Simple Interest vs. Compound Interest: What Your Investment Calculator Is Actually Doing
Why Do Your Investment Projections Seem Wrong? (It's All About Interest)
Type $10,000, 7%, and 30 years into an investment calculator and you'll get back a projection of roughly $76,000. Now do the "obvious" math by hand: 7% of $10,000 is $700 a year, times 30 years is $21,000 in interest, so you should end up with $31,000. That's a $45,000 gap between two answers to the same question — and neither one contains a typo. They're built on two different models of how money grows.
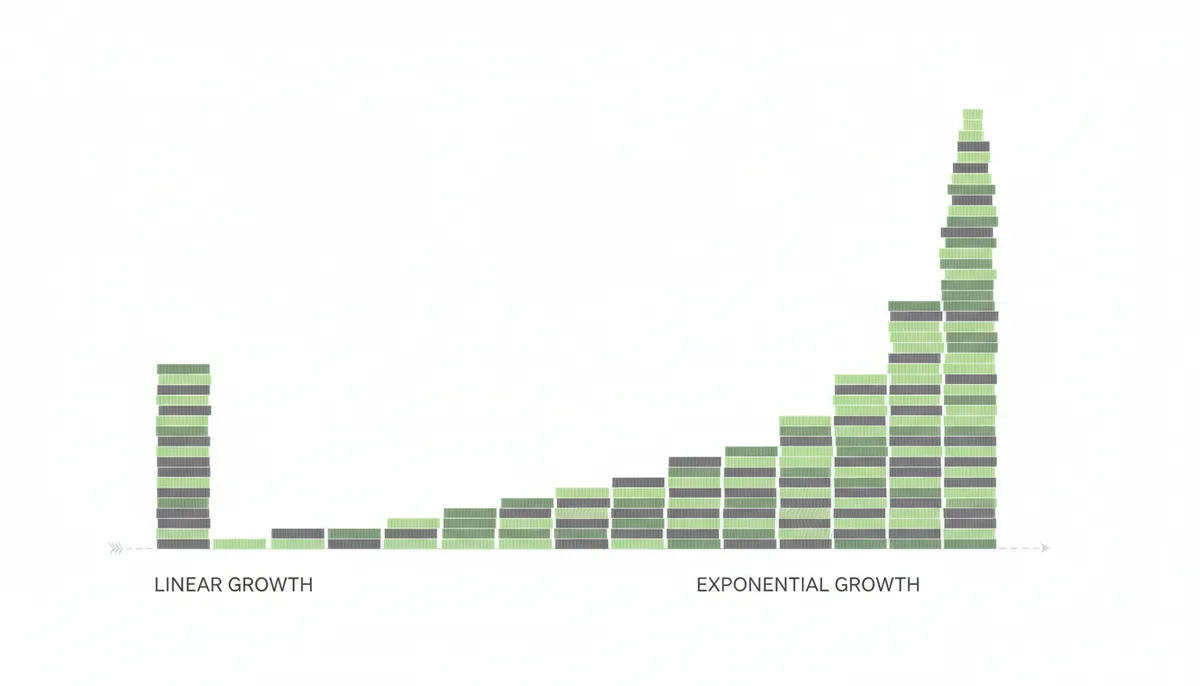
Your hand math assumed simple interest: a fixed slice of the original principal, paid every year, on the original amount only. The calculator assumed compound interest: every interest payment gets folded into the balance, so the next payment is calculated on a bigger number. Simple interest produces linear growth — the balance climbs by the same dollar amount every period, tracing a straight line. Compound interest produces exponential growth — the dollar increments get bigger every period, tracing a curve that bends upward.
Most disagreements between people and calculators trace back to this fork in the road. If your projection seemed suspiciously high, you probably applied compounding to something that doesn't compound. If it seemed too low, you did the reverse — ran simple-interest math against a product, like a savings account or a retirement fund, that compounds relentlessly.
The stakes are not symmetric. Compound interest is the engine behind essentially every long-term investment vehicle you'll ever use — 401(k)s, IRAs, index funds, high-yield savings. Simple interest shows up in narrower territory: certain short-term loans, some auto financing, bond coupons you take as cash. Get the model wrong on a 30-year retirement projection and you're not off by a rounding error. You're off by tens of thousands of dollars, as the opening example shows.
What follows is both formulas with real numbers, a year-by-year look at the widening gap, the compounding-frequency setting almost everyone ignores, and the calculator inputs that control all of it.
What Is Simple Interest? The Straight-Line Path to Growth
Lend a friend $10,000 at 5% simple interest, and the deal works like this: every year, your friend owes you $500. Not 5% of whatever the debt has grown to — 5% of the original $10,000, forever. The interest you earned in year one never joins the calculation. It sits off to the side, inert, while the principal keeps doing all the work alone.
That's the entire mechanism, and it fits in one formula:
I = P × r × t
- P (Principal) — the starting amount. $10,000 in our example.
- r (Interest rate) — the annual rate expressed as a decimal. 5% becomes 0.05.
- t (Time) — the duration in years. 18 months is 1.5, not 18.
The final balance is just the principal plus whatever interest accumulated: FV = P + I, or written as one line, FV = P(1 + rt).
Run our $10,000 at 5% and the pattern is almost boringly predictable:
- Year 1: $500 of interest → $10,500
- Year 2: another $500 → $11,000
- Year 3: another $500 → $11,500
- Year 10: $5,000 total interest → $15,000
- Year 30: $15,000 total interest → $25,000
Every year adds exactly $500. Plot those balances on a chart and you get a perfectly straight line — that's what "linear growth" means in practice: equal dollar steps, no acceleration.
Two unit mistakes cause most simple-interest errors, and both are easy to make in a calculator or spreadsheet. First, entering the rate as 5 instead of 0.05, which returns $50,000 of "interest" in year one — obviously wrong, so at least it announces itself. The subtler version is mixing time bases: a rate quoted per month (say 0.4% monthly) multiplied by a time in years. If the rate is monthly, t must be in months. If the rate is annual, t must be in years. Mismatch them and your answer is off by a factor of 12, and nothing about the result will look obviously insane, which is what makes it dangerous.
My position on simple interest: it's the right tool for short horizons and the wrong one for long ones. Over any period shorter than a single compounding cycle — under a year, for anything that compounds annually — simple and compound interest give identical answers, so there's nothing to gain by complicating the math. Beyond that, simple interest systematically understates how real growth products behave.
What Is Compound Interest? The Snowball Effect Explained
Now change one rule: every time interest is credited, it joins the balance — and from that moment on, it earns interest too. That's the whole idea. "Interest on interest" sounds like a slogan, but it's a literal description of the arithmetic.
The formula looks more intimidating than it is:
FV = P × (1 + r/n)nt
- P — principal, as before.
- r — the annual rate as a decimal.
- t — time in years.
- n — the number of compounding periods per year. Annually means n = 1, quarterly means n = 4, monthly means n = 12, daily means n = 365.
Read the formula as a mechanism rather than a blob of symbols. The exponent nt is just the total number of times interest gets credited — monthly compounding over 10 years means 120 crediting events. The term r/n is the rate applied at each event — 5% compounded monthly means the balance grows by 0.05/12, about 0.4167%, every month. Each period, the entire balance — principal plus every interest payment so far — gets multiplied by (1 + r/n). That repeated multiplication is what bends the line into a curve.
Here's the same $10,000 at 5%, now compounded annually, year by year:
| Year | Starting balance | Interest earned | Ending balance |
|---|---|---|---|
| 1 | $10,000.00 | $500.00 | $10,500.00 |
| 2 | $10,500.00 | $525.00 | $11,025.00 |
| 3 | $11,025.00 | $551.25 | $11,576.25 |
| 4 | $11,576.25 | $578.81 | $12,155.06 |
| 5 | $12,155.06 | $607.76 | $12,762.82 |
Watch the interest column: $500, then $525, then $551.25, then $578.81, then $607.76. The annual raise keeps getting a raise, because each year's interest is computed on a balance that includes all prior interest. Year one is identical to simple interest — $500 exactly — because there's no accumulated interest to compound yet. The divergence starts in year two, quietly, with an extra $25.
After five years the compound balance is $12,762.82 against simple interest's $12,500. A $263 edge. If that seems underwhelming, good — you've noticed the most important thing about compounding. It starts slow. What happens next is the whole story.
Visualizing the Difference: How the Gap Widens Over Time
For the first year, compounding buys you nothing. By year five, it's bought you $263 — nice, but not life-changing. The trick is that the gap doesn't grow at a steady pace. It grows at a growing pace, because the compound balance's advantage is itself compounding.
Extend both models of our $10,000 at 5% across three decades (values rounded to whole dollars):
| Years | Simple interest | Compound interest | Compound's edge |
|---|---|---|---|
| 1 | $10,500 | $10,500 | $0 |
| 5 | $12,500 | $12,763 | $263 |
| 10 | $15,000 | $16,289 | $1,289 |
| 20 | $20,000 | $26,533 | $6,533 |
| 30 | $25,000 | $43,219 | $18,219 |
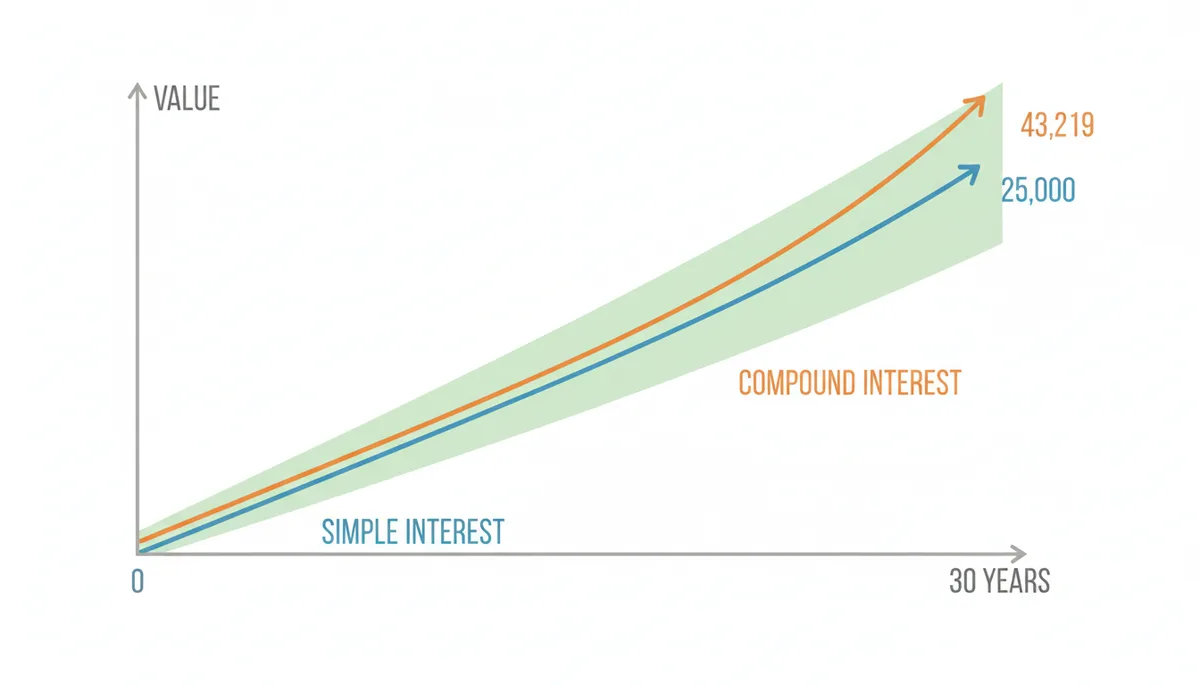
Three things worth staring at in those numbers. First, the edge column accelerates: $0, $263, $1,289, $6,533, $18,219. Each decade's gap dwarfs the one before. Second, by year 30 the compound balance is 73% larger than the simple one — same principal, same rate, same time. Third, and this is the part that matters for retirement planning: the last ten years of compounding add more than the first twenty combined. The first two decades grew the balance by $16,533; the final decade alone added $16,686.
This is why every piece of retirement advice obsesses over starting early. It's not moralizing about discipline — it's arithmetic. The back-loaded shape of exponential growth means the years at the end of your horizon do the heaviest lifting, and the only way to have more years at the end is to start the clock sooner. A 25-year-old and a 35-year-old investing the same amount at the same rate are not separated by ten years of modest difference. They're separated by roughly one full doubling cycle, which at typical returns is the difference between a big number and a number twice as big.
How Compounding Frequency Changes Your Final Amount
The variable n is the most ignored input in the compound interest formula, and it's the one banks quietly compete on. Two accounts can advertise the same 6% rate and pay you different amounts, because n controls how often per year the bank stops, calculates interest, and folds it into your balance so it starts earning its own.
Here's $10,000 at 6% for 10 years under every common frequency:
| Compounding frequency | Periods per year (n) | Final value | Total interest earned |
|---|---|---|---|
| Annually | 1 | $17,908.48 | $7,908.48 |
| Semi-annually | 2 | $18,061.11 | $8,061.11 |
| Quarterly | 4 | $18,140.18 | $8,140.18 |
| Monthly | 12 | $18,193.97 | $8,193.97 |
| Daily | 365 | $18,220.29 | $8,220.29 |
Notice the pattern in the jumps. Going from annual to semi-annual compounding adds $152.63. Semi-annual to quarterly adds $79.07. Quarterly to monthly adds $53.79. Monthly to daily — jumping from 12 periods to 365 — adds just $26.32. Each increase in frequency helps less than the one before. This is the law of diminishing returns baked into the math: as n grows, the formula converges on a ceiling (the theoretical limit is continuous compounding, which would yield $18,221.19 here — 90 cents more than daily).
The practical takeaway isn't "chase daily compounding." It's this: never compare two accounts on their stated rate and compounding frequency separately. Convert both to APY — the effective annual yield, which already has frequency baked in — and compare those. The account with the higher APY pays more, full stop, regardless of how either bank describes its compounding schedule. We'll come back to APR versus APY shortly, because the confusion between them costs people real money.
The Hockey Stick Is Hiding in the Second Half
Fold a piece of paper in half forty times and it would stretch to the moon. That's impossible physically, but the math is right. Each fold doubles the thickness. Most of the distance appears in the last three folds; the first thirty-seven merely set the stage. Compound interest obeys the same geometry. It feels slow, then unfairly fast.

The reason is mechanical, not magical. When interest joins the principal, every future payment is calculated on a larger base. That larger base then produces an even larger payment, which swells the base further. You're not adding interest. You're multiplying by the same factor, over and over. Multiplication repeated becomes exponentiation. A 7% annual return means your balance multiplies by 1.07 every year. After thirty years it has multiplied by 1.07 thirty times, which is roughly 7.6. You haven't earned 7% of your original money thirty times. You've earned 7% of an ever-growing pile.
Here is the threshold that makes retirement math so brutal. At 7%, money doubles in about ten years by the Rule of 72. Start with $10,000. After one decade you have $20,000 — the first decade created $10,000 of wealth. After two decades you have $40,000 — the second decade created $20,000. After three decades you have $80,000 — the final decade created $40,000. The last ten years produced more value than the first twenty combined. The curve stays polite for two decades, then bends upward in a hurry.
That shape is why most people quit too early. Five years in, a compound portfolio looks barely better than a simple-interest savings account. The exponential gap is only fully visible after the second doubling, when the curve finally pulls away from the straight line. If you judge a retirement plan at year five and abandon it for something flashier, you forfeit the back-loaded half of the contract. The wealth was always scheduled to arrive late.
Human brains parse this poorly. We evolved to track linear threats: a predator moving at constant speed, a berry patch depleting steadily. Exponential processes hide in plain sight because the early numbers look boring. A population of bacteria that doubles every hour fills a Petri dish at hour sixty. At hour fifty-nine, it fills half the dish. The "sudden" explosion was inevitable; you just couldn't see it in hour ten. Your retirement account works the same way. If the balance looks unimpressive at year seven, that's exactly what the formula predicts. The hockey stick is scheduled for later.
What does this mean practically? Front-load your contributions, then stop looking. The dollars you deposit before age thirty do a disproportionate share of the lifetime lifting because they sit through the multiplicative folds that come later. Patience isn't a virtue here; it's the physics of the formula.
Sarah and Mike: A 40-Year Ledger
Sarah starts her first job at twenty-five and directs $500 a month into a 401(k). She does this for exactly ten years, then stops forever when she changes careers at thirty-five. Total principal out of her pocket: $60,000. Mike starts at thirty-five — the same monthly $500, same fund, same 7% annual return compounded monthly. He keeps it up for thirty years, all the way to sixty-five. Total principal: $180,000. Mike contributes three times as much cash. Sarah ends up with roughly $92,000 more in her account.
The math is worth tracing because it exposes where the money actually comes from. Over Sarah's first decade, her $500 monthly deposits grow to approximately $86,500 by age thirty-five. That's not the remarkable number. What happens next is: she leaves the account alone for thirty years. At 7% compounded monthly, money multiplies by about 8.1 times over three decades. Her $86,500 base becomes roughly $702,500. She stopped contributing before her career even hit middle management, and the account still climbed past seven figures in waiting. The growth didn't come from her hustle; it came from the clock.
Mike's story is more familiar but less rewarding. He contributes $500 every month for thirty-six straight years, never missing a payment. His final balance is approximately $610,000. Respectable by any standard. And yet he is outgunned by a colleague who walked away from the table three decades earlier. The gap is not because Mike chose a bad fund or because he was unlucky. It's because Mike started too late for his earliest dollars to fold into themselves enough times to matter. His first $6,000 sits for twenty-nine years. Sarah's last $6,000 sits for thirty-one. Those two extra years, applied across the whole balance, generate the winning margin.
Flipping the question reveals the true cost of delay. To match Sarah's roughly $702,500 by age sixty-five, Mike would need to contribute about $575 per month instead of $500 — a 15% heavier lift for every single month of his thirty-year career. Alternatively, he could keep the $500 payment and accept finishing with $610,000, which buys a meaningfully smaller retirement. There's no third option. The exponential clock doesn't negotiate.
The difference is purely chronological. Sarah's final $6,000 deposited at age thirty-four still enjoys thirty-one years of compounding. Mike's first $6,000 deposited at age thirty-five enjoys only thirty. That missing year costs him about $600 on that specific contribution alone. Multiply that shortfall across every deposit, and the gap swells to six figures. In compounding, time is not a backdrop; it's an active ingredient.
Use this comparison as a decision filter, not a guilt trip. If you're young and can only spare $200 a month, fund the account anyway. The specific dollars you deposit in your twenties get strapped to the longest rocket ride. If you're starting at forty-five, you must either save a radically higher percentage of income, plan a later retirement, or accept a lower terminal balance. All three are honest trade-offs. What you cannot do is rerun the previous twenty years of compounding.
The Calculator Errors That Pass the Smell Test
A wrong projection doesn't always look wrong. It looks reasonable, professional, and carefully typed. That's what makes the following errors expensive.
Mixing APY with the rate input. Suppose your bank savings account advertises 5.00% APY. You open an investment calculator, enter 5 as the annual interest rate, and set compounding to monthly. The calculator assumes 5% is the nominal APR and compounds it twelve times, producing an effective yield near 5.12%. You've just given yourself a raise that doesn't exist. The correct input depends on what the calculator asks for. If it asks for APR and handles compounding internally, enter the nominal rate. If it asks for the flat annual rate and you only know the APY, you may need to back-calculate or choose the matching frequency. Use APYs to compare accounts. Don't blindly type them into fields labeled "interest rate."
Ignoring inflation. A calculator projecting $1,000,000 in thirty years at 8% returns is telling the truth numerically. It isn't telling you what that money buys. At an average 3% inflation, the purchasing power of $1,000,000 in thirty years is roughly equivalent to $412,000 today. If you plan retirement spending around the nominal figure, you'll run out of purchasing power halfway through your projections. The fix: run a second calculation using your real rate of return. Subtract inflation from your expected nominal return — 8% minus 3% equals 5% — and project at that rate. The resulting number is what you can actually spend in today's terms.
Wrong contribution timing. Most calculators default to end-of-period contributions: your $500 lands at the last day of the month. If you actually invest on payday, the first of the month, each deposit gets an extra month of compounding. Over thirty years at 7%, beginning-of-month contributions yield roughly $3,600 more than end-of-month on a $500 monthly plan. Small, but entirely real. Check the timing assumption in the calculator settings. If there's no setting, assume end-of-period and know your actual result will be slightly rosier.
Tax blindness. Entering a 10% stock-market return into a taxable brokerage projection and treating the result as spendable is a category error. Bond interest is taxed as ordinary income, often annually, which prevents full compounding. Stock gains are deferred until sale, but dividends are taxed along the way unless held in a tax-deferred account. A 6% bond yield in a 24% federal bracket compounds at an effective 4.56% if coupons are taxed yearly. A 7% return inside a Roth IRA is a true 7%. A 7% return in a traditional IRA is 7% growing, but the tax bill on withdrawals will take a bite out of the terminal value. Match the calculator to the account type.
Treating average returns as stable returns. Calculators draw a straight, smooth exponential curve. Markets deliver jagged lines. If your portfolio averages 7% but wiggles between +25% and -20%, the actual compounded result is lower than the calculator's smooth projection. This is volatility drag. A portfolio that gains 30% then loses 20% has an arithmetic average of +5%, but a geometric (actual) result of +4%. Over decades, a volatile 8% underperforms a steady 7%. If your calculator lacks a volatility adjustment, reduce your expected rate by 0.5 to 1 percentage point as a sanity discount.
When Linear Growth Is the Smarter Bet
Compound interest is the right default for wealth building. It is not the right tool for every financial job. There are moments when you want your money to behave like a reliable machine instead of a growing snowball.
Retired investors living off their portfolio need predictable cash flow more than they need exponential growth. Imagine you hold $500,000 in bonds that pay 5% simple interest. You know with absolute certainty that you will receive $25,000 this year, next year, and every year until maturity. You can build a budget around $2,083 per month. If you instead reinvest those coupons to compound, your income next year might be higher, or it might be lower if rates drop. A predictable $25,000 beats an unpredictable $28,000 when the rent is due. Use simple-interest products for the spending portion of a retirement portfolio, and restrict compounding to the legacy portion you don't intend to touch.
Short-term liability matching is another place where linearity wins. You need $40,000 in exactly twenty-four months for a down payment and moving costs. A two-year certificate of deposit with a fixed simple-interest payout tells you today exactly what you will walk away with. A broad stock-index fund compounded over the same period might deliver $55,000 or $28,000 depending on what the market serves up. When the goal is fixed and non-negotiable, certainty is worth more than expected return. Lock the number.
The psychological factor is underrated. Some savers need to see the interest separate from the principal. A simple-interest savings bond that generates a visible $100 payment every six months provides concrete feedback. The money feels earned. Reinvested compound growth hides inside a larger account balance; the mechanics become invisible. If visibility keeps you saving, accept the lower long-term efficiency. The best strategy is the one you actually maintain.
Then there is administrative simplicity. Compound growth in a taxable brokerage generates dividend reinvestments, fractional shares, and annual 1099-DIV forms that require cost-basis tracking across decades. A simple-interest CD produces one 1099-INT line. For investors who value their time, the bookkeeping drag of compounding has a real cost. You're trading maximum theoretical growth for peace of mind and clean tax records. That trade-off is rational if you know you're making it.
My rule of thumb: compound your wealth during accumulation, then segment your decumulation into simple-interest pools for living expenses and compound-growth pools for long-term medical or legacy funds. One size doesn't fit a forty-year financial life.
When the Snowball Rolls Downhill
Every explanation of compound interest assumes you leave the money alone. Retirement assumes you spend it. That reversal flips the math from accumulation to decumulation, and the curve that worked so hard for you can turn against you just as mechanically.
The danger is sequence-of-returns risk. Imagine two retirees who both start with $1,000,000, both withdraw $50,000 annually, and both experience the same thirty-year set of market returns. The only difference is the order. Retiree A enjoys strong years first: +18%, +12%, +10%. Retiree B is hit immediately: -18%, -12%, -10%. After one year, A's portfolio suffers a $50,000 withdrawal but grows 18% on the remaining $950,000, landing near $1,121,000. B suffers the same withdrawal but shrinks 18% on $950,000, falling to $779,000. Both pulled out the same fifty thousand. One ended the year up $71,000. The other ended down $221,000. The gap after a single year is $342,000, and B never catches up because the same later recovery percentages apply to a drastically smaller base.
This is why the 4% rule is not just about average returns. It is about worst-case early sequences. If negative returns arrive during your first five years of retirement, the compounded losses overlay your withdrawals like a tax you cannot avoid. You are forced to sell more shares when they are cheap, and those shares no longer exist to participate in the rebound. In accumulation, volatility averages out over time. In decumulation, the exact same volatility shreds your terminal wealth because the denominator is shrinking at the wrong moment.
Volatility drag makes the problem worse. A portfolio that averages 8% but delivers it as +30% followed by -20% will compound to less wealth than a steady 7% portfolio. During withdrawal, drag is amplified. You can't afford the deep valleys because your living expenses don't drop when the market does. A standard compound-interest calculator will not show this. It assumes nothing leaves, and it assumes returns are smooth. Retirement is bumpy and leaky.
Credit-card debt is the same curve in reverse. If you pay only the minimum, interest compounds on an increasing balance. The bank owns the snowball. You're standing downhill from it. The mechanism is identical: multiplication of an ever-larger base. The only defense is to interrupt the compounding by paying principal aggressively, because the same exponential patience that builds fortunes will build liabilities just as ruthlessly.
Required minimum distributions add another wrinkle. Once mandatory withdrawals begin, the IRS forces you to pull money from traditional IRAs every year regardless of market conditions. You can't wait out a downturn. You must sell, lock in any losses, and drain the compounding base at the worst possible moment. Plan for this by holding a cash reserve or a simple-interest buffer outside the compounding pool, so you're never forced to sell compound-growth assets into a panic.
The honest takeaway: compound interest is a powerful engine, but only when fuel stays in the tank. The moment you add regular withdrawals, you need a different calculator, a different stress-test, and a healthy fear of the first five years.
Sources
- U.S. Securities and Exchange Commission (SEC) — The official definition and importance of compound interest for long-term investors.
- Financial Industry Regulatory Authority (FINRA) — Information on how investment products like mutual funds and bonds work, and the role of interest and dividends in returns.
- Consumer Financial Protection Bureau (CFPB) — Authoritative definitions of APR and APY and how they apply to savings and loan products.
- The Federal Reserve Board — Economic data and educational resources on interest rates and their function in the economy.