CalculatorLine vs Bankrate Mortgage Calculator: Which Gives the Better Quick Payment Estimate?
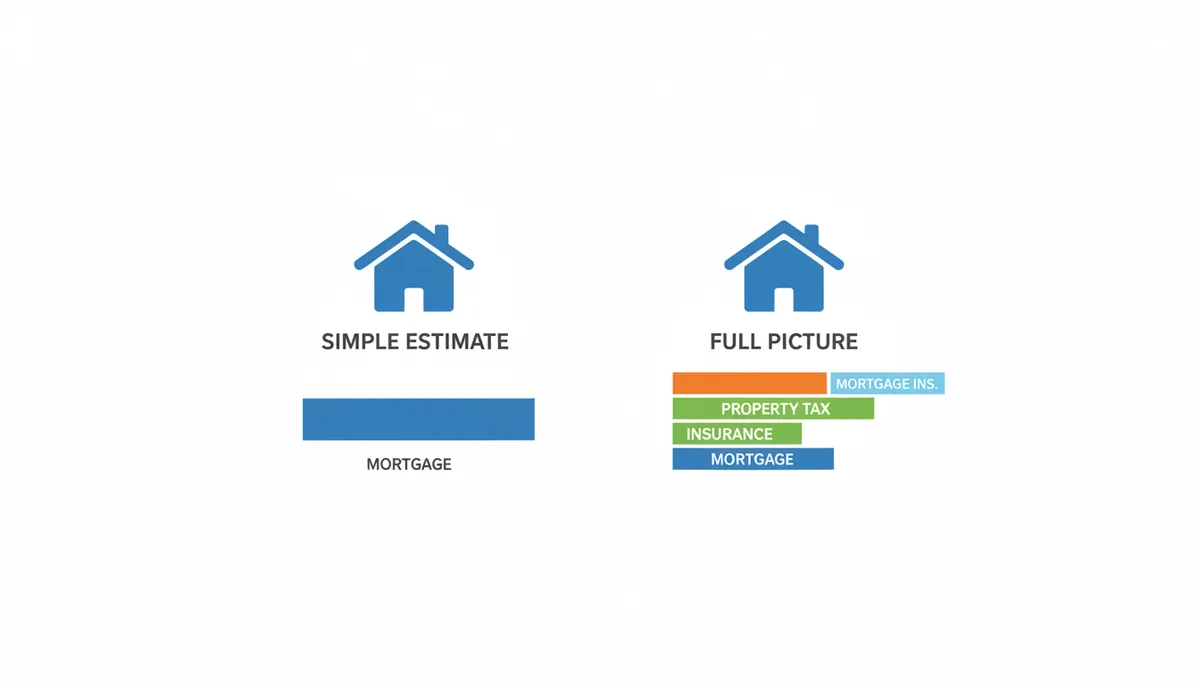
Put a $360,000 home with 10% down into any mortgage calculator at a 6.5% rate and the math comes back the same: $2,048 a month. That number is correct — and nearly useless. The check you'd actually write is closer to $2,660 once property tax, homeowners insurance, and mortgage insurance get added. The gap between those two figures is where most quick estimates go wrong, and it's the first thing to judge in any mortgage payment estimator comparison.
Bankrate and CalculatorLine both run free mortgage calculators that handle the full picture. They just get there differently. Bankrate wraps its calculator in a marketplace: current rate averages, lender offers, editorial guidance stacked around the tool. CalculatorLine gives you the tool itself — no sign-up, no rate tables, nothing competing for your attention. Which one serves you better depends on what "quick" means for you: fast to a number, or fast to a decision.
I ran the same loan scenarios through both. Here's how they compare, feature by feature.
What Are You Really Looking For in a 'Quick' Mortgage Estimate?
The acronym that matters here is PITI: principal, interest, taxes, insurance. Principal and interest retire the loan. Taxes and insurance get collected by your lender each month into an escrow account, then paid to the county and the insurer on your behalf. Because the lender collects them monthly, the payment you're quoted at closing includes them — which is why a P&I-only estimate is a budgeting trap, not a shortcut.
Two more costs pile on for most buyers. Put less than 20% down on a conventional loan and you'll carry private mortgage insurance (PMI), priced as an annual percentage of the loan and paid monthly. Buy into a condo or planned community and homeowners association (HOA) dues join the pile — lenders count those in your debt-to-income ratio even though they're not escrowed.
Run the numbers on our example home. Property tax at 1.1% of value adds $330 a month. A typical homeowners policy adds $150. PMI at 0.5% of the $324,000 loan adds $135. That's $615 on top of the $2,048 — a 30% miss if you budgeted on the headline figure.
So here's the rule before comparing mortgage calculators: for pure rate math — is 6.25% worth the points versus 6.5% — P&I is enough. For anything resembling a household budget, you need a mortgage calculator with taxes and insurance at minimum, and PMI handling if you're under 20% down. The best quick calculator is the one that makes adding those costs frictionless instead of hiding them three screens deep.
First Impressions: Interface Speed and Clarity
Open CalculatorLine's mortgage calculator and the page is the calculator. Inputs sit above the fold, there's no account to create, no email gate, and nothing between you and a result. On a phone, the single-column layout means you're typing numbers with your thumb within seconds of the page loading. Time to first answer: well under a minute, including finding the rate field.
Bankrate's calculator lives inside a larger page. Around it you'll find current average mortgage rates, tables of lender offers, related articles, and display advertising. Expect to scroll. The upside is context — today's average 30-year rate sits near the field where you enter yours, which genuinely helps if you have no idea what rate to type. The downside is that the page is busy, and parts of it exist to move you toward a lender quote.
That's Bankrate's business model, and it's worth understanding rather than resenting. The company earns money when you click through to a lender, and that revenue funds the tool and the journalism around it. When you're actively rate shopping, those offers are a feature. When you want a neutral number at 11 p.m. without anyone asking for your phone number, they're noise.
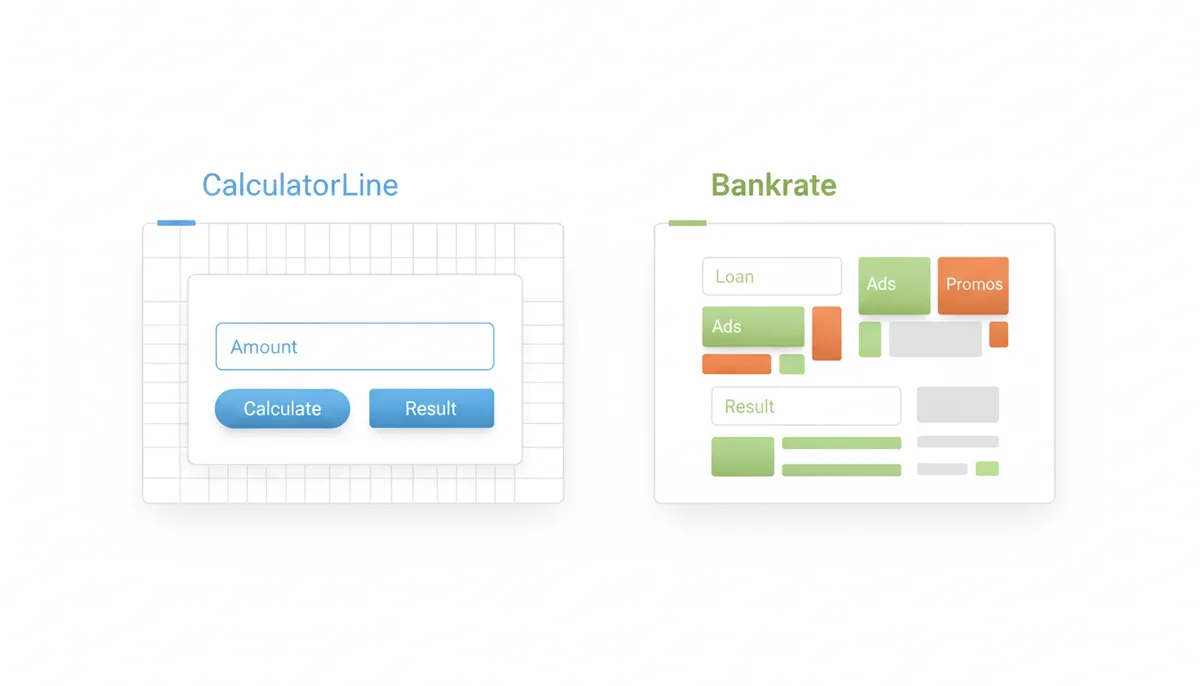
Any honest Bankrate mortgage calculator review has to credit the polish — the tool itself is well-built. The question is whether you want the marketplace that comes attached to it.
Core Inputs: Price, Down Payment, Term, and Rate
Both calculators handle the four essential inputs, and both get the most important detail right: the down payment field syncs between percentage and dollars. Type 10% on a $360,000 price and $36,000 appears; type $50,000 and it flips to 13.9%. This sounds trivial until you're juggling listings — agents talk in price, you think in cash, and flipping between the two without touching a separate calculator saves real time.
On loan term, both cover the standard menu: 30-year fixed, 20, 15, 10. The 30/15 toggle is the single most valuable two seconds in either tool, and here's why with real numbers. That $324,000 loan at 6.5% costs $2,048 a month over 30 years and roughly $413,000 in total interest — more than the loan itself. Switch to 15 years at the same rate and the payment jumps to about $2,822, but total interest collapses to roughly $184,000. In practice the gap widens further, because 15-year loans usually price a bit below 30-year rates. If you've never run that comparison on your own numbers, do it before you do anything else.
The interest rate field is where the two tools philosophically split. Bankrate pre-fills a current market average, which is a kind anchor for a first-timer. Just know what an advertised average assumes: strong credit, a conforming loan, and sometimes discount points — upfront fees that buy the rate down. If your credit is mid-600s, your real quote will look different. CalculatorLine hands you the field and expects you to bring a number, which forces the healthier habit: use a rate from an actual lender quote or pre-approval, not a national average.
On results, both show the monthly payment prominently. What you want visible without extra clicks is total interest over the life of the loan — that's the number that changes behavior. One edge case worth testing: if you're refinancing with, say, 23 years left, check whether the tool accepts a custom term rather than forcing you into 20 or 25. Matching your remaining years keeps the comparison honest.
Taxes, Insurance, and PMI: Where Estimates Get Real
This is the section that separates a PITI calculator comparison from a toy comparison, because these three inputs carry most of the estimation error.
Property tax is the dangerous default. Effective rates run from well under half a percent in Hawaii to more than 2% in New Jersey and Illinois. On a $360,000 home, that's the difference between $1,800 and $7,200+ a year — $450 a month of pure geography. Never accept any calculator's default tax figure. Pull the actual bill on a comparable home from the county assessor's site, or ask the listing agent, and enter that. Bankrate pre-fills an estimate you can edit; CalculatorLine takes your number directly, as an annual amount or a percentage of price. Either works, as long as the number is yours.
Homeowners insurance has spread out enormously in recent years. A policy in a low-risk inland market might run a bit over a thousand dollars a year; premiums in hurricane-exposed coastal areas can run three or four times that. Both tools let you enter a figure — get a real quote early, because this line item now moves the answer by $100–200 a month depending on where you buy.
How the Math Actually Works: What Happens Between Your Input and the Result
Punch identical numbers into CalculatorLine and Bankrate and the Principal & Interest result matches to the dollar. Neither site is copying the other. Both are running the same standard amortization formula that every lender in the country uses to generate your actual Loan Estimate: M = P [ i(1 + i)^n ] / [ (1 + i)^n - 1 ]. There's no proprietary algorithm underneath.
Watch it breathe. Take the $324,000 loan at 6.5% over 30 years. The monthly rate i is 0.065 divided by 12, or 0.0054167. The number of payments n is 360. Raise (1 + i) to the nth power and you get roughly 6.9918. The numerator becomes P × i × 6.9918, which is about $12,271. The denominator is 6.9918 minus 1, or 5.9918. Divide the two and you land at $2,047.97. Both calculators round to $2,048. If you ever wondered why competing sites agree, that's why.
Disagreements, when they happen, come from rounding conventions, not formulas. One engine might carry six decimal places through every payment cycle. Another might round each month's interest to the nearest cent before deducting principal. Over 360 months, that microscopic drift can shift the final balance by a few dollars. Lenders themselves differ on rounding rules, so a five-dollar gap between any calculator and your official Loan Estimate is routine. Don't treat it as a bug.
What the formula doesn't capture is prepaid interest at closing. Because mortgage interest is paid in arrears, your first regular payment — typically due on the first of the following month — covers the interest for that next full month. Meanwhile, you must prepay the interest that accrues from your closing date through the end of the month in which you close. On a $400,000 loan at 7%, daily interest is roughly $77. Close on the 20th of a 30-day month and you will prepay roughly 10 or 11 days of interest, about $770 to $845, at signing. Neither Bankrate nor CalculatorLine asks for your closing date, so neither warns you about this line item. If you are estimating cash-to-close, set aside that prepaid interest alongside your down payment and closing costs. Then add the lender's escrow cushion — usually two months of tax and insurance reserves — which can run $1,000 or more on its own.
The front-loaded interest that shocks first-time buyers is just the formula doing its job. Month one interest equals current balance times monthly rate: $324,000 × 0.0054167 = $1,755. Since the payment is fixed at $2,048, only $293 reduces principal. Month two recalculates on $323,707, so $1,753 goes to interest and $295 to principal. This slope is inescapable. The only ways to flatten it are a lower rate, a smaller starting balance, or extra principal payments.
Extra payments rewrite the schedule manually. Throw $5,000 at the loan in month 13 and the calculator can't predict the new payoff date unless you feed that lump sum into an extra-payment module. Both sites offer these, but the underlying math is identical: every extra dollar skips the interest that dollar would have generated for the remaining 348 payments. At 6.5%, a $5,000 extra payment in year two saves roughly $11,500 in interest over the life of the loan. The formula doesn't care which site runs it.
Understanding this frees you from calculator shopping. The math is universal. Your energy belongs in the inputs: the rate you negotiate, the points you buy or skip, and the prepaid interest you will owe at the closing table.
A Worked Example: The $425,000 House and the Budget That Almost Broke
You found a house listed at $425,000 in a county where property tax runs 1.15%. You have $45,000 saved. The listing says HOA dues are $120 a month. Your loan officer quoted you 7.125% on a 30-year fixed with 5% down. Before you drive back for a second showing, run the real number.
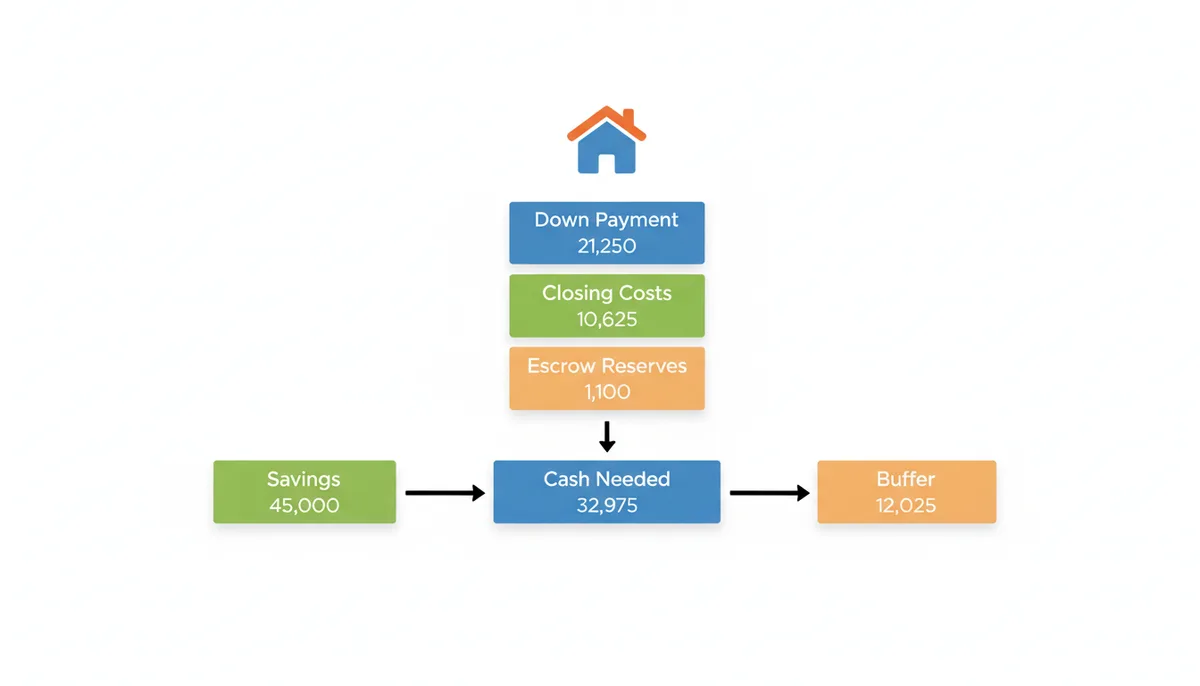
Start with cash. Five percent down is $21,250. Closing costs in your market run roughly 2.5% of the price, or $10,625. The lender will also collect two months of tax and insurance reserves for the escrow cushion, about $1,100. That brings your cash need to roughly $32,975. Your $45,000 leaves you a $12,000 buffer for inspections, moving, and the inevitable broken water heater. Tight, but you proceed.
Now fill the calculator fields. Home price: $425,000. Down payment: $21,250. Loan amount: $403,750. Rate: 7.125%. Term: 30 years. The P&I formula spits out $2,721.
| Cost Component | Annual | Monthly |
|---|---|---|
| Principal & Interest | $32,652 | $2,721 |
| Property Tax (1.15%) | $4,888 | $407 |
| Homeowners Insurance | $1,920 | $160 |
| PMI (roughly 0.85% of loan) | $3,432 | $286 |
| HOA Dues | $1,440 | $120 |
| Total Monthly | $44,332 | $3,694 |
Here's the reality check. You earn $7,500 a month gross. Your housing ratio — PITIA divided by income — is $3,694 divided by $7,500, or 49.2%. Many conventional guidelines cite 36% as a common housing-ratio benchmark and 43% as a frequent total debt-to-income ceiling, but those are not universal caps. Automated underwriting systems sometimes approve higher ratios when compensating factors such as deep cash reserves, a high credit score, or a low loan-to-value ratio are present, and FHA programs routinely tolerate ratios near 50% or higher. Still, a 49.2% front-end ratio is severely stretched for a conventional borrower. Add a $450 car payment and $350 in student loans and your total DTI approaches roughly 59.3%, a level most automated systems decline regardless of compensating factors. The calculator just exposed the stretch in 90 seconds.
Where the tools diverge is what happens next. CalculatorLine leaves you staring at the $3,694 in silence. That's either a feature or a flaw, depending on your temperament. Bankrate surrounds the result with lender offers advertising 6.875% or "first-time buyer programs." A lower rate would drop the P&I to $2,652 and the total to $3,625. You're still above the common 43% total DTI benchmark. The marketplace nudge tempts you to chase rate instead of accepting the simpler truth: you need a cheaper house, a bigger down payment, or more income. The math is identical on both sites. The environment around the math is not.
If you want to salvage this budget, change the down payment to 10% ($42,500). The loan drops to $382,500, cutting P&I to $2,579. PMI also falls because the coverage amount is lower and the LTV tier improved; call it 0.4% for a monthly PMI of $128. Your new total is roughly $3,394. At $7,500 gross income you're now at 45.3% housing ratio — still above the 36% benchmark, but back inside the range where a strong credit profile and some cash reserves might keep the file alive with a manual underwriter. Which interface let you toggle that down payment faster? That speed matters when you're standing in the kitchen of a house you're not sure you can afford.
The Four Costly Mistakes People Make With Quick Estimates
Quick mortgage calculators are only as honest as the fingers typing into them. Here are the errors that turn a $2,800 estimate into a $3,400 reality, and the specific consequences of each.
Mistake 1: Typing the APR into the interest-rate field. Your lender quotes a note rate of 6.875% and an APR of 7.094%. The note rate is what the bank charges on your balance. The APR folds in lender fees, points, and some closing costs to give you an apple-to-apple cost comparison across lenders. Mortgage calculators expect the note rate. Feed them the APR and they treat it as the borrowing cost, inflating your payment by $50 to $80 a month. Use the note rate for payment math. Use APR only when judging which of two loans is cheaper over five or seven years.
Mistake 2: Trusting the default property-tax figure. Bankrate will pre-fill a state average. CalculatorLine might leave the field blank. In either case, if you don't overwrite it with a location-specific number, you're guessing. The real danger hits in reassessment-on-sale states. The seller paid tax on an assessed value of $340,000. You bought for $425,000. Next year the assessor resets to sale price. A "default" tax of $280 a month jumps to $407. Your escrow analysis in month thirteen catches up, and your payment spikes $127 — plus a catch-up bill for the first year's shortfall.
Mistake 3: Assuming PMI evaporates on schedule. Both calculators show PMI ending roughly when the amortization schedule hits 78% loan-to-value. On a 30-year loan with 10% down, that takes years. But home values rarely stay flat. In a normal appreciation environment, you hit 80% LTV on market value years earlier than the amortization schedule suggests. The lender won't automatically cancel PMI based on market value; you must request it and pay for an appraisal. The calculator cannot model local appreciation, so its PMI timeline is a worst-case baseline, not a promise. Bankrate's calculator may not even flag this distinction, and CalculatorLine's clean output certainly doesn't nag you about it. Set a calendar reminder yourself at year three.
Mistake 4: Ignoring interim interest and escrow setup. Calculators give you the regular monthly payment. They don't warn you that closing on the 20th of the month means 40 days of per-diem interest due at signing — roughly $1,400 on a $400,000 loan at 7%. They also don't show the two-month escrow cushion most lenders require for taxes and insurance. If your annual tax and insurance run $6,720, the lender collects $1,120 upfront as a cushion. Add odd-days interest and you're looking at roughly $2,500 beyond your down payment and standard closing costs. If you budgeted for 5% down plus 2% closing costs but forgot the cushion and interim interest, you're short at the closing table. The calculators aren't wrong; they're just not designed to estimate cash-to-close. Use them for monthly budgeting, not wire-transfer planning.
The Alternative Toolkit: When Neither Site Fits Your Workflow
CalculatorLine and Bankrate aren't the only games in town. Depending on where you are in the hunt, another tool might be faster or more honest.
Excel or Google Sheets reward the hands-on buyer. Build a PMT formula for P&I: =PMT(0.065/12,360,-324000) returns the $2,048 we saw earlier. Add columns for tax, insurance, PMI, and HOA, then copy the principal/interest split down 360 rows. The upfront cost is time — plan on 45 minutes to build a clean model, or 10 minutes to adapt a reputable template. The payoff is scenario density. You can run 15 homes side by side, instantly seeing how a $20,000 price cut stacks up against a 0.25% rate reduction. Use conditional formatting to highlight the month PMI drops off, or chart cumulative interest over time. The risk is human error: hard-code your PMI drop-off at the wrong month, or forget to reassess taxes in year two, and the model lies with absolute confidence. I use spreadsheets once I have three specific addresses in play and want to optimize between them.
Zillow has a built-in calculator tied directly to listings. Its killer feature is tax history pulled from county records for that exact address. The trap is assuming history equals future. In most jurisdictions, sale triggers reassessment to purchase price. Last year's $2,800 tax bill was based on the seller's $310,000 assessed value and a millage rate of 0.009032. Your $425,000 purchase resets the assessed baseline while keeping the same millage. The bill jumps proportionally. Zillow's calculator often defaults to the historical annual number, undercutting your estimate by 25% or more. Use Zillow to find the millage and any special assessment districts, then compute (Purchase Price × Millage) / 12 for an honest monthly figure.
NerdWallet operates on the same marketplace model as Bankrate — lender offers, educational content, calculator wrapped in a sales funnel. The tool itself is solid, but the interface loads heavier tooltips and longer explainer copy. For a first-time buyer who doesn't know what PITI stands for, that hand-holding is useful. For a repeat buyer running eighth or ninth scenarios on a Sunday night, it is friction.
Your lender's own portal is the most accurate once you have a pre-approval and an address. Their PMI pricing reflects your actual credit tier. Their tax estimates use the local escrow department's analysis, not a national average. Their rate includes your specific discount-point situation. The catch: you can't use it anonymously, and it only shows that lender's products. It is a validation tool, not an exploration tool.
My recommended workflow: CalculatorLine for rapid, neutral screening across dozens of listings. Zillow for property-specific tax research, with reassessment salt. Bankrate or NerdWallet when you want current rate averages and are ready to comparison-shop lenders. A personal spreadsheet once you're down to three finalists. Your lender's calculator for the final week before you lock the rate. Each tool has a window where it wins; the mistake is using only one for the entire marathon.
When the Standard Formula Fails: ARMs, Jumbos, and Refinance Traps
The amortization formula works beautifully for conventional, fixed-rate, conforming loans. Step outside that box and both CalculatorLine and Bankrate can quietly mislead you. Here's where their limits harden.
Adjustable-rate mortgages. A 5/1 ARM lists a teaser rate of 5.75%. You plug it in, see a friendly payment, and believe you can afford more house. Neither site's standard fixed-rate calculator models the adjustment mechanics: the index (usually SOFR), the margin (often 2.75%), and the caps (commonly 2% initial, 2% periodic, 5% lifetime). If the underlying index rises significantly by the time the loan resets at month 61, your rate could jump by two percentage points in a single bound. On a $400,000 loan, that adds hundreds of dollars a month. The calculators show you year one; they don't show you the cliff. If you are ARM-shopping, use a specialized ARM calculator that runs the worst-case max-capped scenario, or build the adjustment schedule in Excel with the caps hard-coded. Running an ARM through either site's standard mortgage tool is outright dangerous.
Jumbo loans. Conforming loan limits vary by county and adjust annually. In high-cost areas they can exceed $1 million, but in most of the country anything above the FHFA baseline is jumbo. Both calculators will accept a $900,000 loan amount happily. What they won't tell you is that jumbo loans do not use standard PMI. Lenders typically require a piggyback second lien, single-pay mortgage insurance, or simply a larger down payment to avoid insurance altogether. The calculator slaps standard monthly PMI onto your quote; your lender removes it and instead raises the rate or demands a second mortgage. The P&I math is correct, but the total-cost math is fiction.
Refinancing with rolled-in closing costs. You owe $380,000 and want to roll $9,000 in fees into the new loan. You enter $389,000 as the home price and zero down payment. The calculator returns a payment on that balance. What it misses is the cash-flow asymmetry: refinancing usually skips one monthly payment, giving you a month of relief, while raising your balance permanently. It also misses that your old escrow account gets refunded three weeks after closing, which offsets some of the new escrow setup. The calculator gives the conservative, higher-balance number. That is safe for budgeting, but it makes refinancing look slightly worse than it is on a net-present-value basis.
Cash-out refinancing. Most calculators let you enter any loan-to-value ratio. Try 90% on a cash-out refi and you get a payment. In reality, conventional cash-out loans typically max at 80% LTV. FHA allows higher, but with upfront mortgage insurance premiums the calculator does not model. The tool gives you a number your lender will reject.
FHA and VA loans. Neither calculator properly handles FHA's upfront mortgage insurance premium — often financed into the loan balance — or the specific duration rules for annual MIP, which differ from conventional PMI and usually persist for years regardless of equity buildup. For VA loans, the funding fee varies based on your down payment and whether you have used your VA benefit before, and it can be financed or paid at closing. Standard PITI calculators have no field for VA funding fees. If you are eligible for these programs, use the FHA or VA-specific calculators on the official HUD and VA sites. The general-purpose tools will understate your true costs by thousands.
Sources
If you are still toggling between tabs, here is the scorecard.
| Feature | CalculatorLine | Bankrate |
|---|---|---|
| Fastest first estimate | Immediate; single column, no gates | Fast, but page weight and offers add friction |
| Rate guidance / defaults | Blank field; you bring the number | Pre-filled market average; useful anchor, sometimes misleading |
| Taxes and insurance handling | Manual entry; no skewed defaults | Pre-filled state estimates; faster, but verify against local bills |
| PMI / HOA handling | Toggle and manual rate entry | Auto-applied with down-payment trigger |
| Extra payment / amortization usefulness | Clean schedule, easy scenario toggling | Robust charts and year-over-year detail |
| Privacy / no-lead-gen experience | No ads, no forms, no data collection | Surrounded by lender offers and rate tables |
| Lender-shopping context | None; purely analytical | Integrated live rates and partner lender network |
| Best user | Buyers running dozens of neutral what-ifs | First-time buyers who want rate context and lender options |
Use CalculatorLine when you want fast, ad-free screening across dozens of listings without being nudged toward a lender application. It is the sharper tool for pure exploration. Use Bankrate when you are ready to understand where your quoted rate sits against the market and you want a guided path to lender comparisons. The surrounding offers are a feature, not a distraction, at that stage. When you are within days of locking a rate, abandon both and move to your chosen lender's own portal. That is the only place your exact credit tier, discount points, and escrow analysis converge into a binding Loan Estimate. The bottom line: CalculatorLine for fast neutral screening, Bankrate for rate-context and lender shopping, lender portal for final quote validation.
Refer to the CFPB's owning-a-home guidance for official definitions of PITI, PMI, APR, and details on the Loan Estimate.