Why Two Online Calculators Give Different Answers for the Same Inputs
It's Not the Math, It's the Model: Why 'Same Inputs' Aren't Always the Same
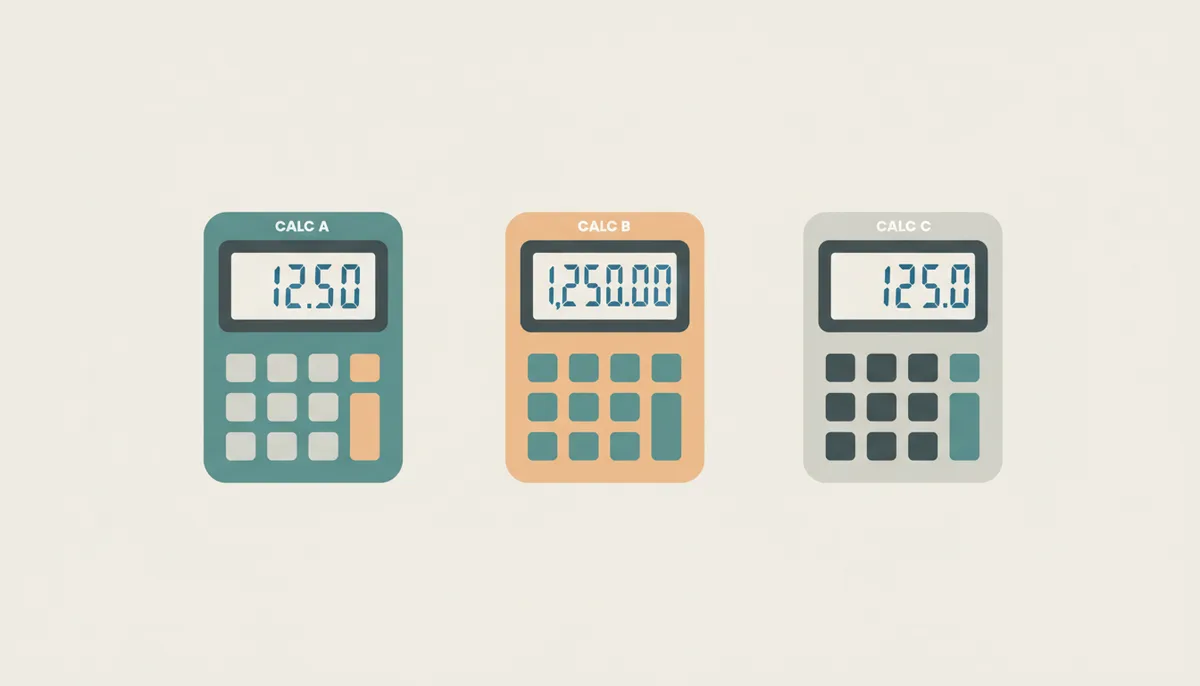
You punch your mortgage details into one calculator and get $2,387 per month. Same numbers in another calculator: $2,855. A third gives you $2,412. You check your typing three times. The numbers are identical, but the answers aren't even close.
This happens every day with mortgage calculators, investment projections, BMI calculations, and calorie counters. The discrepancy feels like a bug, but it's actually a feature — or rather, a collection of features that calculator designers build into their tools without telling you.
The core issue isn't mathematical error. It's that "same inputs" is an illusion. Behind that simple interface, each calculator makes dozens of decisions for you: what to include, what to exclude, which formula to use, how to handle edge cases, when to round, and what data source to trust. These choices compound into wildly different outputs.
Understanding why calculators disagree isn't just academic curiosity. When you're making a $500,000 mortgage decision or planning your retirement, a "small" difference in assumptions can mean tens of thousands of dollars over time. This article gives you a framework to diagnose exactly why two calculators disagree and determine which one you should trust for your specific situation.
We'll dissect four main categories of calculator differences: the assumptions baked into the code, formula variations that are all technically "correct," data sources that update at different speeds, and the subtle math of rounding that creates drift over time. More importantly, you'll get a step-by-step diagnostic process to investigate any calculator discrepancy yourself.
What Hidden Assumptions Are Baked Into Your Calculator?
Most calculators hide critical assumptions to keep their interface clean. They make choices about tax rates, insurance costs, inflation projections, and compounding frequencies without asking you. These invisible defaults are the biggest source of calculator disagreement.
Take mortgage calculators. You enter loan amount, interest rate, and term — say $400,000 at 7% for 30 years. Calculator A shows $2,661 per month. Calculator B shows $3,195. That's a $534 difference, enough to disqualify you from the loan entirely.
The culprit? Calculator A only calculates principal and interest (P&I). Calculator B assumes you want the full PITI payment — principal, interest, taxes, and insurance. It quietly adds 1.2% of home value for property tax and $1,200 annually for homeowner's insurance. Neither calculator is "wrong." They're answering different questions.
This pattern repeats everywhere. An investment calculator showing lower returns might assume annual compounding while another uses monthly. A seemingly pessimistic retirement calculator might include a 3% inflation assumption that others ignore. A calorie calculator giving you 500 fewer calories than expected might use the newer Mifflin-St Jeor equation instead of the older Harris-Benedict formula.
The most dangerous assumptions are the reasonable ones. A mortgage calculator assuming 20% down payment seems sensible — until you're only putting down 10% and don't realize it's adding PMI to your payment. An investment calculator using 7% average market returns sounds conservative — until you discover it's using nominal returns while another uses real (inflation-adjusted) returns.
Some calculators let you modify these assumptions through an "Advanced Settings" button. Others lock them in completely. The honest ones at least document their choices somewhere. But many calculators — especially quick widgets embedded in blog posts — give you no visibility into what they're assuming on your behalf.
Before trusting any calculator, ask yourself: what else affects this calculation beyond the numbers I'm entering? For mortgages, it's taxes, insurance, PMI, and HOA fees. For investments, it's inflation, taxes, fees, and compounding frequency. For calories, it's your activity level and metabolic variance. If the calculator doesn't let you specify these factors, it's making assumptions. Different assumptions mean different answers.
Are They Using the Same Formula? The 'Right' Way Can Vary
Even when two calculators ask for identical inputs and make no hidden assumptions, they can still produce different results. The reason: multiple valid formulas exist for many common calculations, especially in health, fitness, and finance.
BMR (Basal Metabolic Rate) calculation perfectly illustrates this. The Mifflin-St Jeor equation, developed in 1990, gives one result. The Harris-Benedict equation, revised in 1984, gives another. The Katch-McArdle formula, which requires body fat percentage, gives a third. Each formula was developed by studying different populations and optimizing for different goals. All three are widely used in medical and fitness settings.
For a 35-year-old woman, 5'6" tall (167.64 cm), weighing 150 pounds (68.04 kg), the calculations work out as follows: Mifflin-St Jeor: (10 × 68.04) + (6.25 × 167.64) - (5 × 35) - 161 = 1,392 calories. Revised Harris-Benedict: (9.247 × 68.04) + (3.098 × 167.64) - (4.330 × 35) + 447.593 = 1,444 calories. That's a 52-calorie difference — which becomes 81 calories daily after applying a moderate activity multiplier of 1.55, potentially affecting weight by 8-9 pounds per year.
| Formula Name | The Formula Itself | When It's Most Accurate |
|---|---|---|
| Mifflin-St Jeor | Men: (10 × weight in kg) + (6.25 × height in cm) - (5 × age in years) + 5 Women: (10 × weight in kg) + (6.25 × height in cm) - (5 × age in years) - 161 |
Generally recommended for average adults, particularly those who are overweight |
| Harris-Benedict (Revised) | Men: (13.397 × weight in kg) + (4.799 × height in cm) - (5.677 × age in years) + 88.362 Women: (9.247 × weight in kg) + (3.098 × height in cm) - (4.330 × age in years) + 447.593 |
Widely used in clinical settings, may overestimate for sedentary individuals |
| Katch-McArdle | Both sexes: 370 + (21.6 × lean body mass in kg) Note: Requires body fat percentage to calculate lean mass |
Most accurate for lean, athletic individuals who know their body composition |
Financial formulas have similar variations. APR (Annual Percentage Rate) sounds standardized, but implementation details vary. Some calculators use 365 days per year, others use 360 (common in banking). Some include origination fees in the APR calculation, others don't. The Truth in Lending Act provides guidelines, but edge cases remain ambiguous.
Body fat percentage calculations show even more variety. The U.S. Navy method uses neck and waist measurements. The YMCA formula only needs waist circumference. The U.S. Army method adds hip measurements for women. Each formula emerged from studying different populations and optimizing for different accuracy goals.
Even "simple" calculations hide complexity. Converting nominal interest rates to effective rates depends on compounding frequency. The formula changes slightly if compounding is continuous versus discrete. Most users never notice, but over 30 years of mortgage payments, these formula variations can create thousand-dollar discrepancies.
The lesson: when two calculators disagree, neither might be wrong. They might be using equally valid but different formulas. The question becomes not "which is correct?" but "which formula best fits my situation?" A bodybuilder should use Katch-McArdle for BMR. A sedentary office worker might get better results from Mifflin-St Jeor. Understanding which formula a calculator uses — and why — helps you choose the right tool for your needs.
Your 5-Step Checklist to Diagnose Any Calculator Difference
When two calculators give different answers, you need a systematic way to figure out why. This five-step diagnostic process transforms you from confused user to calculator detective, able to spot exactly where the tools diverge.
Step 1: Hunt for the methodology page. Look for links labeled "How we calculate," "Methodology," "About this calculator," or a small "i" icon. Good calculators explain their assumptions, formulas, and data sources. If you can't find any documentation after 30 seconds of searching, that's your first red flag. A calculator that won't explain itself is hiding something — usually outdated formulas or aggressive assumptions.
Step 2: Test with round numbers. Replace your real inputs with simplified versions: $100,000 instead of $97,500, 10% instead of 6.875%, 1 year instead of 27 months. Round numbers make the math transparent. If one calculator shows a $10,000 yearly payment and another shows $10,500, you can immediately see one is adding 5% somewhere. This technique would quickly reveal if a calculator were adding hidden fees or using non-standard assumptions.
Step 3: Change one variable at a time. Start with both calculators showing the same result (using round numbers if needed). Now change exactly one input — increase the loan amount by $10,000. Do both calculators change by the same amount? If not, you've found a nonlinear assumption. One calculator might have PMI kick in at 80% LTV while another uses 78%. This isolation technique reveals threshold effects and hidden rules.
Step 4: Find and explore advanced settings. Many calculators hide crucial options behind "Advanced," "More options," or "Settings" buttons. These sections often reveal the default assumptions: tax rates, insurance costs, inflation adjustments, compounding frequencies. Change these hidden inputs to match between calculators. If the results converge, you've found your culprit. If they don't, the difference runs deeper — likely different formulas or calculation methods.
Step 5: Scrutinize the labels. Read every field label carefully. One calculator asks for "Interest Rate," another for "APR." One wants "Gross Income," another "Net Income." These aren't synonyms. APR includes fees that interest rate doesn't. Gross versus net can create a 25% difference. Even "Monthly Payment" might mean different things — one calculator might include escrow, another might not.
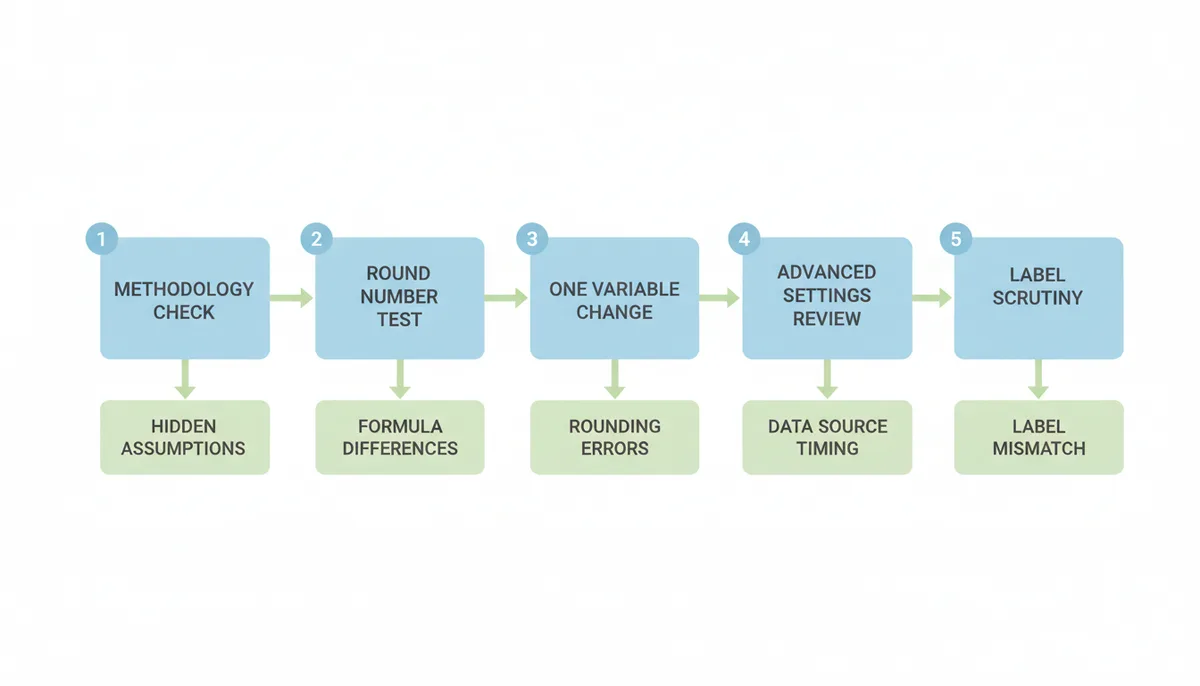
This process works for any type of calculator. When two BMI calculators disagree, Step 3 might reveal one uses metric conversion differently. When investment calculators clash, Step 4 often uncovers different default inflation rates. When calorie calculators vary, Step 1 usually shows they're using different BMR formulas.
The power of this checklist is that it turns frustration into understanding. Instead of wondering if all calculators are unreliable, you can pinpoint exactly why they disagree and make an informed choice about which to trust.
Case Study: Why Two Mortgage Calculators Disagree on a $500,000 Loan
Let's apply our diagnostic checklist to a real scenario. You're buying a $625,000 house with $125,000 down, leaving a $500,000 loan. You've locked in a 6.5% interest rate for 30 years. Calculator A says your monthly payment is $3,160. Calculator B says $3,791. That's a $631 difference — which one should you believe for budgeting?
Step 1: Hunting for methodology. Calculator A has a small "How this is calculated" link revealing it computes "principal and interest only using standard amortization." Calculator B has no documentation, but the results page mentions "including estimated taxes and insurance."
Step 2: Testing with round numbers. We simplify to a $100,000 loan at 10% for 10 years. Calculator A shows $1,321.51 monthly. Calculator B shows $1,488.38. Using a manual calculation, the P&I alone should be $1,321.51. Calculator B is adding approximately 12.6% extra — suspiciously close to typical PITI additions.
Step 3: Isolating variables. We change only the loan amount from $100,000 to $200,000. Calculator A doubles from $1,321.51 to $2,643.02. Calculator B doesn't quite double — it goes from $1,488.38 to $2,894.94. This non-linear scaling suggests Calculator B includes fixed costs (like insurance) plus percentage-based costs (like property tax).
Step 4: Finding advanced settings. Calculator A has none — it's purely P&I. Calculator B has a subtle "Customize" button revealing defaults: 1.2% property tax, $1,500 annual homeowner's insurance, and no PMI since we have 20% down. For homes above $400,000, it also estimates HOA fees.
Step 5: Checking labels. Calculator A clearly states "Monthly P&I Payment." Calculator B labels its result "Total Monthly Payment" with a tooltip explaining "includes principal, interest, taxes, insurance, and HOA if applicable."
| Component | Your Inputs | Calculator A (P&I) | Calculator B (PITI) |
|---|---|---|---|
| Loan Amount | $500,000 | $500,000 | $500,000 |
| Interest Rate | 6.5% | 6.5% | 6.5% |
| Loan Term | 30 years | 30 years | 30 years |
| Property Tax | Not asked | Not included | 1.2% of $625,000 = $625/month |
| Home Insurance | Not asked | Not included | $1,500/year = $125/month |
| PMI | Not asked | Not included | $0 (20% down payment) |
| HOA Fees | Not asked | Not included | $0 (not shown in original) |
| Monthly Payment | — | $3,160 | $3,910 |
Now the math adds up: $3,160 (P&I) + $625 (property tax) + $125 (insurance) = $3,910. The $119 difference from the original $3,791 likely comes from Calculator B using slightly different default rates when we first ran it — perhaps 1.0% property tax instead of 1.2%.
This case reveals why calculator discrepancies matter. If you budget based on Calculator A's $3,160, you'll be short $750 every month when the real bills arrive. But Calculator B's assumptions might be wrong too — your actual property tax rate could be 0.8% instead of 1.2%, and your insurance quote might be $2,000 instead of $1,500.
The lesson: neither calculator is absolutely right or wrong. Calculator A gives you the pure loan cost. Calculator B attempts to estimate total housing payment. For budgeting, you need Calculator B's comprehensive approach — but with your actual tax rate, insurance quotes, and HOA fees, not its guesses.
The Ghost in the Machine: How Rounding and Precision Create Drift
Even when two calculators use identical formulas and assumptions, they can still produce different results. The culprit is the invisible math happening between your inputs and the final answer — rounding decisions and floating-point precision that compound into noticeable differences.
Consider a simple investment growing at 7% annually for 30 years. One calculator might show a final value of $76,122.55. Another shows $76,143.42. The $21 difference seems trivial until you realize it represents a 0.027% variance that materialized from nowhere. No different assumptions. No different formulas. Just different decisions about when and how to round.
The issue starts with how computers store decimal numbers. In floating-point arithmetic, 0.1 + 0.2 doesn't exactly equal 0.3 — it equals 0.30000000000000004. This tiny imprecision, governed by the IEEE 754 standard, affects every calculation. Most of the time, smart rounding hides these errors. But over hundreds of compounding periods, they accumulate.
Rounding for display versus rounding during calculation creates the biggest discrepancies. Calculator A might compute your monthly payment as 2661.15654789, round to $2,661.16 for display, but keep using 2661.15654789 internally. Calculator B might round to 2661.16 immediately and use that for all subsequent calculations. Over 360 payments, this creates different total interest amounts.
The order of operations matters too. Calculating (principal × rate) ÷ 12 gives a different result than principal × (rate ÷ 12) due to intermediate rounding. For a $400,000 loan at 6.5%, the first approach yields a monthly rate of 0.00541666..., while the second gives 0.00541667. That fifth decimal place difference compounds into hundreds of dollars over the loan term.
Some calculators use banker's rounding (round to nearest even number), others use conventional rounding (always round up at 0.5). For a single calculation, this rarely matters. But a mortgage amortization schedule involves 360 rounding decisions. If payment amounts, interest portions, and remaining balances are all rounded differently, the accumulated drift becomes significant.
Time calculations introduce another source of drift. Is a year 365 days or 365.25? Is a month 30 days, 30.42, or the actual number of days? A 30-year calculation using 365-day years yields 10,950 days. Using 365.25-day years gives 10,957.5 days. That week of difference affects every compound interest calculation.
High-precision calculators might use 15 decimal places internally. Consumer-friendly ones might use 6. For a single payment, the difference is invisible. But errors compound exponentially. A 0.000001% monthly error becomes 0.0036% after 30 years. On a million-dollar portfolio, that's $36,000 of phantom variance.
You can't eliminate these differences, but you can minimize their impact. When comparing calculators, focus on the first two decimal places — further precision is often illusory. For long-term projections, expect small variances and plan accordingly. Most importantly, understand that tiny differences in intermediate calculations can create notably different final answers, even when everything else matches perfectly.
Is Your Calculator Using Fresh Data? The Timeliness Factor
Some calculator discrepancies have nothing to do with math or assumptions. They're about time. Currency converters, cryptocurrency calculators, and market-linked investment tools can show different results simply because they're pulling data from different moments or different sources.
"Real-time" is marketing speak, not a technical standard. One currency calculator might update every 100 milliseconds from the interbank market. Another updates hourly from a central bank feed. A third uses yesterday's closing rates. During volatile periods, these timing differences create substantial discrepancies.
Take this morning's EUR/USD conversion. At 9:15 AM, Calculator A shows 1.0832. Calculator B shows 1.0849. Calculator C shows 1.0791. Checking their data sources reveals the issue: Calculator A pulls from Reuters with a 15-minute delay, Calculator B uses live interbank rates, and Calculator C still shows yesterday's European Central Bank reference rate.
For a €10,000 conversion, these rates produce results of $10,832, $10,849, and $10,791 — a $58 spread. The "correct" answer depends on what you're actually doing. Planning next month's vacation? Yesterday's rate is fine. Executing a business transaction? You need live market rates. Filing tax documents? You might need the official government rate from a specific date.
Cryptocurrency calculators amplify this problem. Bitcoin can move 5% in an hour. One calculator showing $43,255 while another shows $41,890 might both be "correct" — just pulling from different exchanges or using different time windows. Binance, Coinbase, and Kraken all have slightly different prices at any moment due to market microstructure.
Even seemingly stable data changes more than you'd expect. Mortgage rate calculators pulling from different sources might show 6.5% versus 6.7% for the same loan type. One uses Freddie Mac's weekly survey (backward-looking), another uses daily rate sheets from major lenders (current), a third uses real-time bond market data (forward-looking).
Data providers matter as much as timing. Official government sources update slowly but carry authority. Financial data vendors like Bloomberg or Refinitiv offer speed and accuracy but might require subscriptions. Free sources often aggregate or approximate, introducing another layer of variance.
Some calculators average multiple sources to smooth out anomalies. Others pick the median to avoid outliers. A few show the highest and lowest available rates. These methodological choices — all reasonable — create different results from identical raw data.
Investment return calculators face a special challenge: which historical period to use. One might use S&P 500 returns from 1950-present (averaging 10.5%). Another uses 2000-present (averaging 7.8%). Both are "historical returns," but they paint very different pictures of future wealth accumulation.
The solution is transparency, not perfection. Good calculators tell you their data source, update frequency, and timestamp. Great ones let you override with your own data or choose between sources. When calculators disagree due to timing, ask yourself: which timeframe matches my actual use case? The most current data isn't always the most relevant.
How to Choose a Calculator You Can Actually Trust
After diagnosing why calculators differ, you still need to pick one. The goal isn't finding the "perfect" calculator — it's matching the tool to your specific need while understanding its limitations. Here's how to evaluate calculator quality and choose wisely.
Transparency comes first. A calculator that won't explain its methodology is like a financial advisor who won't discuss their fees. Look for clear documentation about formulas, assumptions, and data sources. The best calculators link to academic papers or government standards supporting their approach. If a mortgage calculator won't tell you whether it includes taxes and insurance, find one that will.
Control distinguishes good from great. Basic calculators give you three fields and one answer. Professional-grade tools let you modify every assumption. Can you change the inflation rate? Override the tax estimate? Switch between calculation methods? More controls mean more work, but also more accurate results tailored to your situation.
Authority matters for serious decisions. The IRS withholding calculator carries more weight than a blog widget for tax planning. Vanguard's retirement calculator reflects deeper expertise than a generic finance site. For legally or financially significant calculations, prioritize tools from organizations with skin in the game — government agencies, established financial institutions, or academic sources.
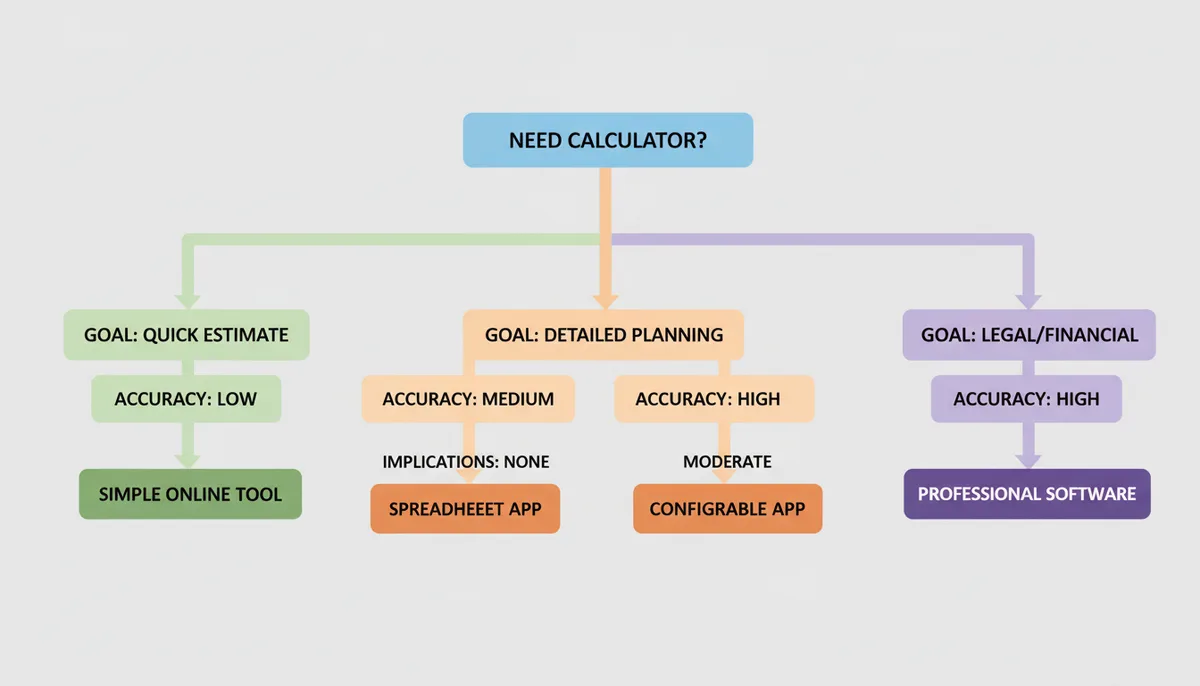
Match precision to purpose. Planning tonight's restaurant tip? A simple percentage calculator works fine. Comparing 30-year mortgage options? You need a tool that handles taxes, insurance, and prepayment scenarios. The stakes determine the sophistication required.
Beware false precision. A retirement calculator showing "$2,847,293.47" in future value creates an illusion of certainty. Good calculators acknowledge uncertainty with ranges or scenarios. If a tool promises exactness about events decades away, it's overselling its capabilities.
Cross-validation builds confidence. For important calculations, use three calculators and understand why they differ. If all three agree within 2%, you've likely found a reliable answer. If they vary by 10% or more, you need to dig deeper into their assumptions.
Red flags to avoid: calculators that require personal information before showing results, tools that don't explain their calculations, widgets that haven't updated their tax rates or regulatory limits in years, and any calculator that seems to systematically favor one outcome (like unrealistically high investment returns).
For quick estimates, prioritize simplicity and speed. CalculatorLine.com's basic mortgage calculator works well for comparing loan amounts during house hunting. For final decisions, upgrade to tools with full PITI calculations and prepayment modeling. For tax filing, only use IRS-provided calculators.
Remember that calculators are decision support tools, not decision makers. A mortgage calculator can tell you the payment amount, but not whether you can actually afford it considering your other goals. A BMI calculator can plot your number on a chart, but not assess your individual health. Use calculators to inform your thinking, not replace it.
The most trustworthy calculator is one whose limitations you understand. Every tool makes trade-offs between simplicity and accuracy, generality and precision. When you know what those trade-offs are, you can use the tool appropriately and interpret its results wisely.
The Compound Interest Trap: Why Small Differences Explode Over Time
A 0.1% difference in your investment calculator seems trivial. On $10,000, it's just $10 per year. But that tiny variance isn't static — it compounds. After 30 years, that 0.1% difference grows to $3,000. After 40 years, it's $5,000. This exponential growth of small errors is why calculator discrepancies matter most for long-term projections.
Consider two retirement calculators projecting 35 years into the future. You're 30, saving $500 monthly, with $20,000 already invested. Calculator A uses 7% annual returns and shows $1,023,000 at retirement. Calculator B uses 7.2% and shows $1,098,000. Just 0.2% difference in assumed returns creates a $75,000 gap in projected wealth.
But the real trap is deeper. That 0.2% return difference might come from Calculator A using arithmetic mean returns while Calculator B uses geometric mean. Or Calculator A might deduct a 0.2% expense ratio that Calculator B ignores. These aren't errors — they're different models of reality. The arithmetic mean of 10% and -10% is 0%, but your actual return is -1% (you go from $100 to $110 to $99).
Monthly versus annual compounding creates another multiplicative difference. For 7% annual interest, monthly compounding yields an effective rate of 7.23%. Over 35 years, this 0.23% difference compounds to about 8% more money. Stack this with the arithmetic/geometric mean difference, add varying inflation assumptions, and suddenly those "small" discrepancies produce retirement projections that differ by $200,000.
Tax treatment multiplies these errors further. One calculator might assume tax-deferred growth (401k), another assumes taxable accounts with annual tax drag. A third might model Roth IRA tax-free growth. At 7% returns with a 22% tax rate, the taxable account only nets 5.46% after taxes on dividends and capital gains. Over decades, this creates vastly different outcomes from the same gross return assumption.
The solution isn't finding a "more accurate" percentage — it's understanding the multiplication effect. When evaluating long-term projections, focus on the range of outcomes, not the point estimate. If small assumption changes create large outcome differences, you're seeing the compound interest trap in action. Plan for the conservative case, hope for the optimistic one, and never trust precision beyond what the underlying assumptions support.
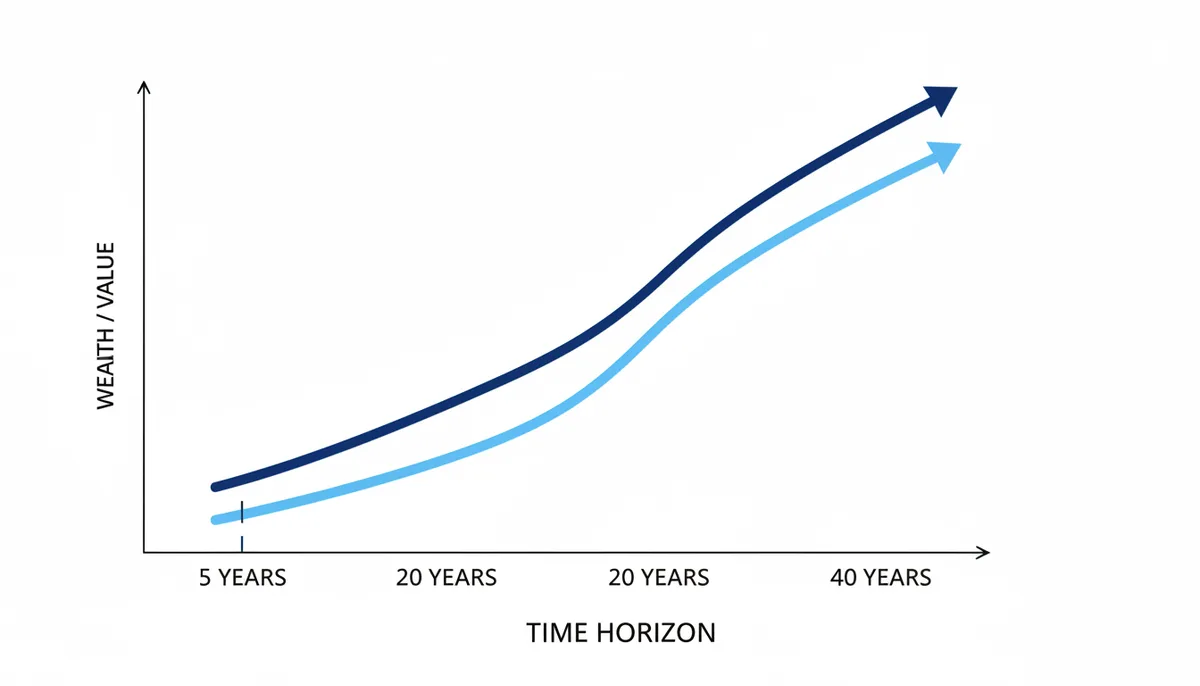
For any calculation spanning decades, ask: what happens if each assumption is off by just 0.5%? If the answer dramatically changes your plans, you need either more conservative assumptions or more flexible plans. The compound interest trap means that long-term calculators aren't really calculating the future — they're showing you how sensitive your plans are to assumptions about that future.
FAQ
So, are all online calculators basically wrong?
No, they're not wrong — they're specialized tools built for specific scenarios. A mortgage calculator excluding taxes isn't "wrong," it's answering a narrower question about loan cost versus total housing payment. The key is understanding which question each calculator is designed to answer and whether that matches your need.
Can I use a financial calculator for legal or tax purposes?
Never rely on generic calculators for official filings. For tax obligations, use only IRS-provided calculators or work with a qualified tax professional. For legal documents, court filings, or regulatory compliance, consult specialists. General calculators are for planning and estimation, not for satisfying legal requirements.
Why does my phone's basic calculator give a different answer than a scientific one for the same problem?
Basic calculators typically process operations sequentially as you type them — entering 2 + 3 × 4 gives 20 (calculating left to right: 2 + 3 = 5, then 5 × 4 = 20). Scientific calculators follow order of operations (PEMDAS/BODMAS), giving 14 (calculating 3 × 4 = 12, then 2 + 12 = 14). Neither is broken — they're designed for different use cases.
How can I find the formula a website is using?
Start with footer links like "Methodology," "How It Works," "About This Calculator," or "Technical Notes." Check for small info icons (i) or question marks near the results. Good calculators embed this information directly on the page. If you can't find any documentation after checking these places, consider it a warning sign about the calculator's transparency and reliability.
Is a calculator with more input fields always better?
More fields usually indicate more control over assumptions, which improves accuracy — if you have good data for those fields. A mortgage calculator with separate fields for taxes, insurance, and HOA fees will be more accurate than one that estimates everything. But if you're just browsing houses and don't know these specifics yet, a simpler calculator might be more practical.
Are online calculators reliable enough to trust for big decisions?
They can be, if you choose one that is transparent, allows you to control assumptions, and comes from an authoritative source. Cross-check results, understand the assumptions, and, for major financial or legal decisions, consult professionals. Calculators are tools to inform decisions, not to replace expert advice.
Sources
- Consumer Financial Protection Bureau (CFPB) — Definitions and official calculation components for financial terms like APR, PITI, and PMI, particularly for the mortgage case study.
- Centers for Disease Control and Prevention (CDC) — Information on Body Mass Index (BMI) and the standard formulas used for its calculation, backing the section on formula variations.
- National Institute of Standards and Technology (NIST) — Authoritative information on standards for numerical precision and rounding rules, supporting the section on rounding and floating-point arithmetic.
- IEEE Standards Association — The source for the IEEE 754 standard for floating-point arithmetic, which is the technical underpinning for how computers handle non-integer calculations.
- The American Council on Exercise (ACE) — Discussion of various valid methods for calculating body composition metrics like body fat percentage (e.g., US Navy method), supporting the 'different formulas' section.
- MIT OpenCourseWare — Academic-level explanations of fundamental computing concepts like floating-point representation and order of operations, providing a rigorous basis for those technical points.