BMI vs Body Fat Percentage: Which Health Calculator Should You Use
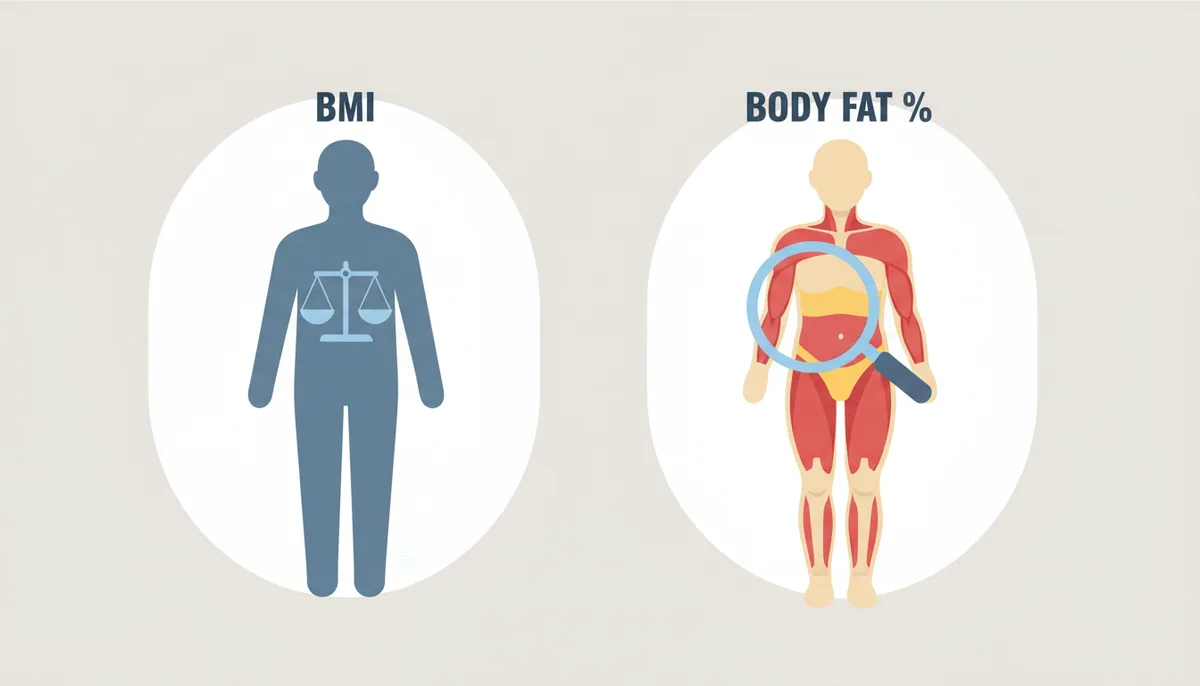
You’ve likely seen both: a BMI calculation after a doctor’s visit, or a body fat percentage reading at the gym. Maybe you’ve been told you’re “overweight” despite feeling strong, or “normal weight” while feeling soft. This disconnect is common and frustrating. It highlights a fundamental problem with relying on a single number to define your health. Many people spend years chasing a "normal" BMI only to realize it doesn’t reflect how they look or, more importantly, how they feel.
This guide explains the differences between Body Mass Index (BMI) and body fat percentage, and helps you decide which metric – or combination of metrics – is the most meaningful for your goals.
1. Is Your BMI Lying to You? Why a Single Number Isn't the Whole Story
Imagine a professional rugby player. They’re incredibly fit, powerfully built, and carbohydrate-fueled. But at 6’2” and 280 pounds, their BMI would classify them as ‘obese’ (over 30). This stark example illustrates a key limitation of BMI: it doesn't distinguish between muscle and fat.
Conversely, consider someone who weighs 150 pounds and is 5’10”, putting them in the “normal” BMI range. However, they may have very little muscle mass and a higher-than-healthy body fat percentage. This is often called "skinny fat."
BMI is a quick, easy calculation, and often the first port of call for a health assessment. Body fat percentage, on the other hand, aims to give a much more precise picture of your body composition. The crucial difference? BMI is a population-level health risk indicator, while body fat percentage provides insight into your individual body composition. This article will equip you to determine which measurement suits your needs, whether it's a general health check or a deep dive into fitness and body recomposition.
2. What Is BMI and What Was It Designed to Measure?
The Body Mass Index (BMI) is calculated using a simple formula: weight in kilograms divided by height in meters squared (kg/m²). If you're using pounds and inches, calculators like those on CalculatorLine.com do the conversion for you. The formula was created in the 1830s by Adolphe Quetelet, a Belgian mathematician, but not as a diagnostic tool. He intended it as a way to quickly assess the weight of populations, aiding in public health tracking during famines and resource allocation.
Today, the World Health Organization (WHO) and the Centers for Disease Control and Prevention (CDC) categorize BMI as follows:
- Underweight: Below 18.5
- Normal Weight: 18.5 – 24.9
- Overweight: 25 – 29.9
- Obese: 30 or greater
These categories are linked to increased risks of health problems, like heart disease, type 2 diabetes, and certain cancers, at a population level. However, it’s vital to remember BMI measures ‘heavy-for-height’— it doesn’t tell you what makes up that weight, only that it's proportionally high or low for your height.
3. What Is Body Fat Percentage and Why Does It Matter?
Body fat percentage describes the proportion of your total body weight that is fat mass, expressed as a percentage. Unlike BMI, it directly addresses body composition. Your body isn’t just weight; it’s a complex blend of fat mass and lean mass— which includes muscle, bone, water, and organs.
Fat isn’t all bad. Essential fat is crucial for hormone regulation, vitamin absorption, and protecting organs. But beyond this essential level, stored fat—subcutaneous fat (under the skin) and visceral fat (around the internal organs)—can pose health risks. Excess visceral fat, in particular, is strongly linked to increased risk of chronic diseases.
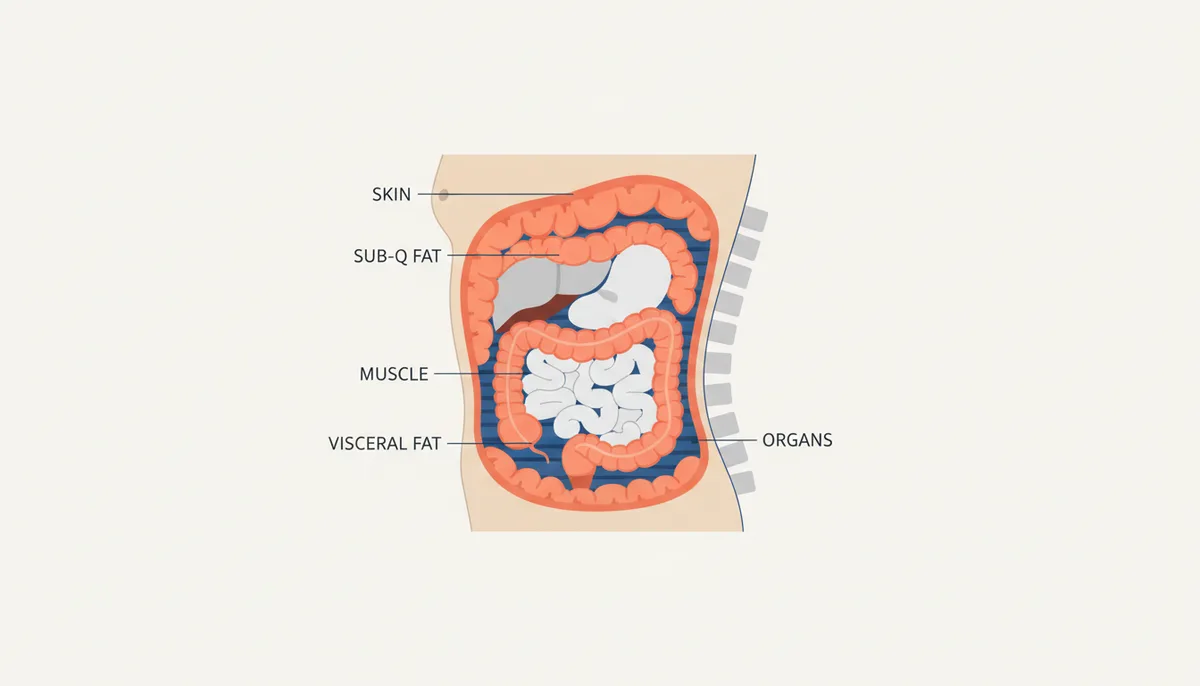
Understanding your body fat percentage offers a more comprehensive picture of your health risks than BMI alone because it focuses on what's actually impacting metabolic health – the amount of stored fat, and especially where that fat is located.
4. BMI vs. Body Fat Percentage: A Side-by-Side Comparison
Here's a direct comparison to help you weigh the pros and cons of each metric:
| Attribute | BMI | Body Fat Percentage |
|---|---|---|
| What It Measures | Heavy-for-height | Proportion of body weight that is fat mass |
| Calculation Method | Weight (kg) / Height (m²) | Various methods (see section 6) |
| Cost & Accessibility | Free; easily calculated online | Ranges from free (tape measure) to expensive (DEXA scan) |
| Accuracy for Individuals | Low to moderate; easily influenced by muscle mass | Moderate to high, dependent on measurement method |
| Usefulness for Populations | High; useful for tracking population-level trends | Moderate; valuable for specific groups (athletes, seniors) |
| Key Limitation | Doesn’t differentiate between fat and muscle mass | Accuracy depends on the method used; may require specialist equipment |
As you can see, BMI wins on convenience. You can calculate it instantly. But body fat percentage offers a deeper understanding of your health, as long as you are prepared to invest the time and, potentially, money to measure it accurately.
5. When BMI Fails: Who Shouldn't Rely on This Metric?
BMI isn’t a reliable indicator for everyone. Athletes, particularly those with significant muscle mass, are often misclassified as overweight or obese. Muscle weighs more than fat; a powerfully built athlete can have a high BMI despite having very low body fat.
Older adults are another group where BMI can be misleading. With age, people naturally lose muscle mass (sarcopenia) and tend to gain fat. This can result in a “normal” BMI masking a concerning increase in body fat.
Furthermore, there's growing recognition that standard BMI thresholds don’t apply equally across different ethnic groups. Finally, the phenomenon of being “skinny fat” – having a normal BMI but high body fat and low muscle – illustrates how misleading BMI can be when it doesn’t reflect body composition. Someone with a normal BMI can still have metabolic problems associated with excess fat.
6. How Is Body Fat Percentage Actually Measured?
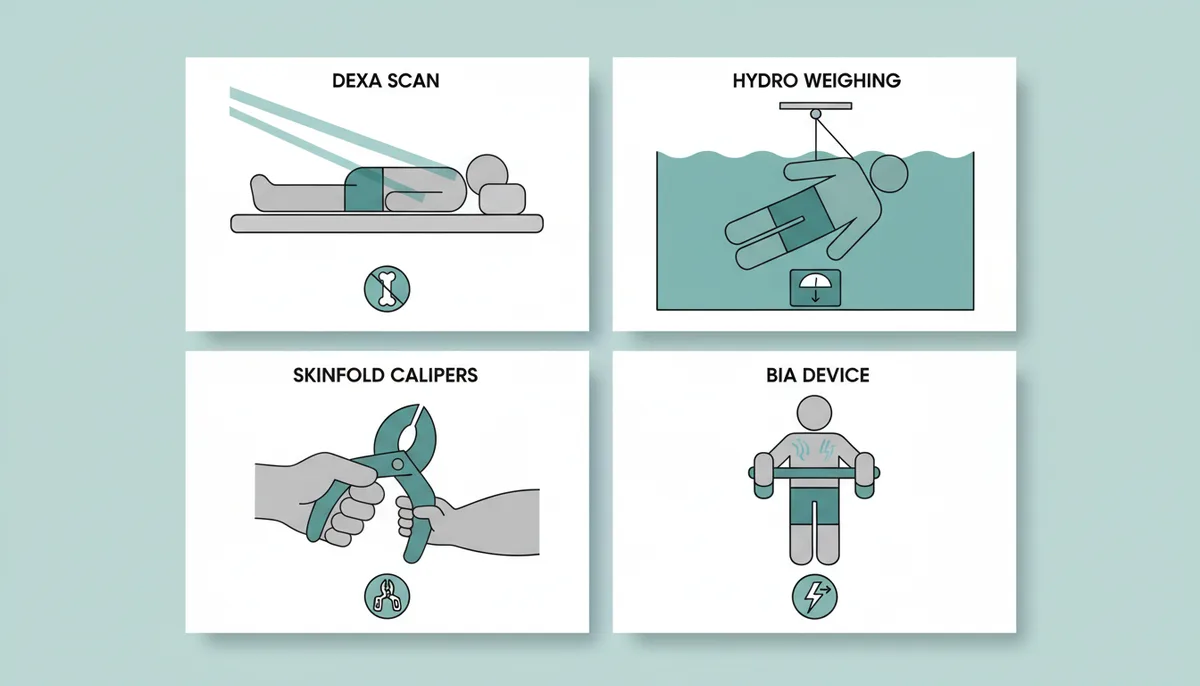
Body fat percentage can be measured using a variety of methods, ranging from clinical-grade accuracy to affordable at-home estimates. Here’s a breakdown:
- Clinical/Lab Methods:
- DEXA (Dual-Energy X-ray Absorptiometry): Considered the “gold standard”. Uses low-dose X-rays to accurately measure bone density, lean mass, and fat mass. Research and reviews compare DEXA to other techniques.
- Hydrostatic Weighing: Measures body density by submerging you in water. Accurate, but requires specialized equipment.
- Air Displacement Plethysmography (Bod Pod): Uses air displacement to measure body volume and calculate body density.
- Practitioner/Gym Methods:
- Skinfold Calipers: Measures the thickness of skinfolds at specific body sites. Relatively inexpensive, but accuracy depends heavily on the skill of the technician.
- Bioelectrical Impedance Analysis (BIA): Sends a harmless electrical current through your body, measuring resistance (impedance). Water conducts electricity, while fat resists it. Lower accuracy than DEXA, but convenient and increasingly sophisticated.
- At-Home Methods:
- Tape Measure Formulas (e.g., US Navy Method): Uses measurements of waist, hips, and sometimes neck, to estimate body fat percentage based on regression equations.
- Consumer BIA Scales: Similar to professional BIA devices, but generally less accurate.
| Method | How It Works | Typical Cost | Accessibility | Accuracy/Precision | Best For... |
|---|---|---|---|---|---|
| DEXA | Low-dose X-rays measure bone density, lean mass & fat mass | Clinical-price | Specialized clinics | Very High | Research, athletes needing precise data |
| Hydrostatic Weighing | Water displacement to calculate body density | High | Limited facilities | High | Research, competitive athletes |
| Bod Pod | Air displacement to measure body volume | High | Some universities/clinics | High | Similar to hydrostatic, less cumbersome |
| Skinfold Calipers | Measures skinfold thickness at specific sites | Moderate | Gyms, trainers | Moderate (technician-dependent) | Tracking changes over time with consistent technician |
| Bioelectrical Impedance (BIA) | Electrical current measures body composition | Moderate | Clinics, gyms | Moderate (hydration-dependent) | Convenient, tracking trends with consistent hydration |
| 3D Body Scans | Uses light to create a 3D model of the body | Moderate | Specialized clinics | Moderate-High | Visualizing body composition changes |
| Tape Measure Formulas | Measurements of waist, hips, neck, etc. | Low | Home | Low | Easy, affordable, tracking trends (consistency is key) |
The “best” method depends on your budget, accessibility, and desired level of accuracy. DEXA is the gold standard, but home methods can provide valuable insights if used consistently to track trends.
7. What Do Your Numbers Mean? Interpreting BMI and Body Fat Results
As noted earlier, BMI categories are: Underweight (<18.5), Normal (18.5-24.9), Overweight (25-29.9), and Obese (≥30). These categories provide a general indication of health risk, but should be interpreted cautiously, especially if you are an athlete or older adult.
Body fat percentage interpretation varies by gender, age, and fitness level. Here's a general guide presenting reference ranges:
| Gender | Essential Fat | Athletes | Fitness | Acceptable | Obese |
|---|---|---|---|---|---|
| Men | 2-5% | 6-13% | 14-17% | 18-24% | 25% + |
| Women | 10-13% | 14-20% | 21-24% | 25-31% | 32% + |
Remember these are guidelines. The goal isn't necessarily to reach the lowest possible percentage, but to fall within a healthy range that supports your overall well-being. Focus on tracking changes over time rather than getting fixated on a single daily measurement as numbers can fluctuate.
8. The Final Verdict: Which Metric Should You Track for Your Health Goals?
If you're looking for a quick, free assessment of potential health risks, BMI can be a useful starting point. It’s readily available and provides a general overview. However, for anyone serious about understanding their health, optimizing their fitness, or monitoring body composition changes, body fat percentage is the superior metric.
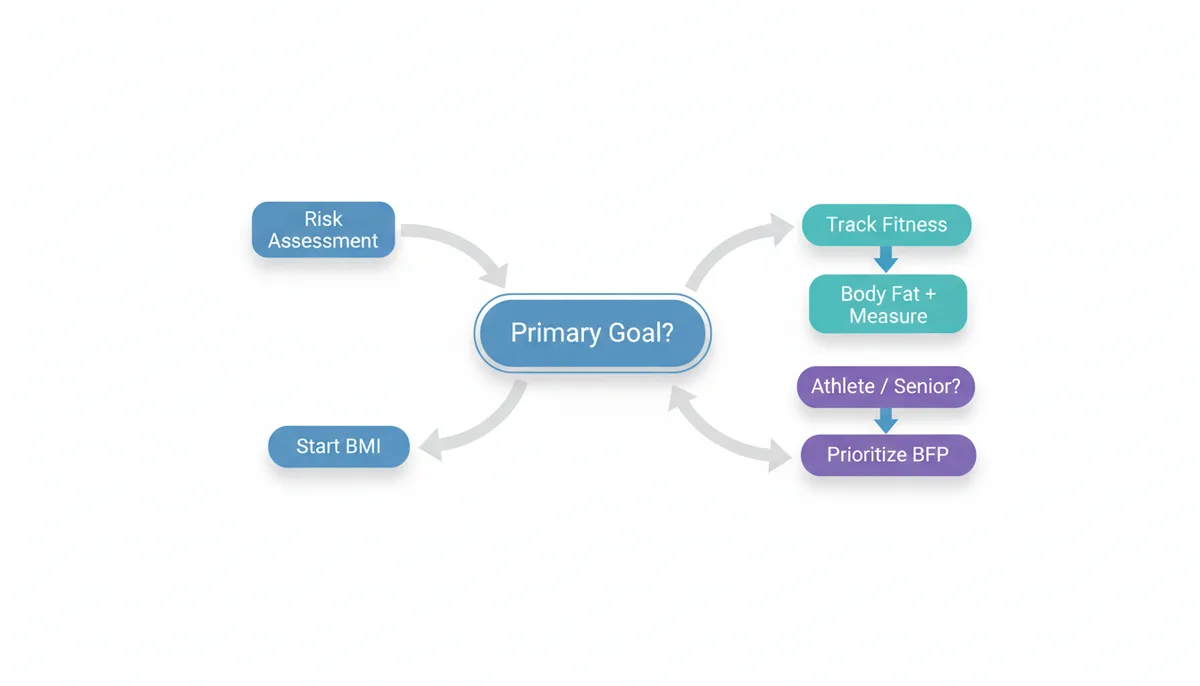
For athletes, seniors, or anyone concerned about "skinny fat," body fat percentage provides invaluable insights. The best approach is often to use both – BMI as an initial screening tool and body fat percentage (along with other measures like waist circumference) for a more comprehensive and actionable understanding of your health. Combine a regular BMI check with frequent body fat measurements for a balanced and informed approach to managing your well being.
9. Beyond the Percentage: Understanding Visceral vs. Subcutaneous Fat
Knowing your overall body fat percentage is a great start, but where you store that fat matters just as much. Fat isn't a uniform entity; it exists in different forms with varying impacts on your health. The two primary types are subcutaneous fat and visceral fat. Subcutaneous fat lies directly beneath the skin. While visible, and often the target of aesthetic goals, it’s generally considered less harmful than its counterpart.
Visceral fat, however, is a different story. It’s stored deep within the abdominal cavity, surrounding internal organs like the liver, intestines, and heart. This internal fat accumulation is strongly correlated with increased risk of chronic diseases, including heart disease, type 2 diabetes, certain cancers, and even cognitive decline. Visceral fat is metabolically active, meaning it releases hormones and inflammatory substances that can disrupt normal bodily functions.
The danger of visceral fat isn’t just its presence, but its impact on organ function. It can lead to insulin resistance, contributing to type 2 diabetes, and it’s linked to the development of non-alcoholic fatty liver disease (NAFLD). It also increases the risk of cardiovascular events. Determining your relative fat distribution is often done through waist circumference measurements. A waist circumference of over 35 inches for women and over 40 inches for men is considered an indicator of increased visceral fat, even if BMI is normal. Waist-to-height ratio (WHtR) is also gaining popularity, and is calculated by dividing your waist circumference by your height. A WHtR above 0.5 is associated with increased health risks.
Consider this example: Sarah is 5’6” and weighs 160 pounds, giving her a BMI of 25.8 (overweight). Her body fat percentage is 22%, which is within the acceptable range for women. However, she's a regular exerciser, but her waist circumference is 38 inches. This signals a higher proportion of visceral fat, suggesting she still faces increased health risks despite her acceptable body fat percentage. This highlights the need to consider both overall body fat and its distribution. Tools like DEXA scans can provide a more precise measurement of visceral fat content, but simpler methods like waist circumference can offer an initial assessment.
10. The Pitfalls of DIY Body Fat Measurement: Accuracy vs. Consistency
While clinical methods like DEXA provide the most accurate body fat assessments, they aren't always accessible or affordable. This leads many people to rely on at-home methods – skinfold calipers, BIA scales, or tape measure formulas. However, these methods are prone to error, and understanding those pitfalls is crucial for interpreting results.
Skinfold calipers, for example, require a skilled technician. Placement of the calipers, the amount of pressure applied, and the specific sites measured can significantly impact the results. Even a slight variation in technique can lead to discrepancies of several percentage points. Online tutorials can help, but mastering the technique takes practice and ideally, instruction from a certified professional.
BIA scales are even more susceptible to error. BIA relies on the principle that electrical current flows more easily through muscle (which contains a lot of water) than through fat. However, hydration levels can drastically affect the reading. Being dehydrated will overestimate body fat, while being well-hydrated will underestimate it. Time of day, recent exercise, and even food intake can all influence hydration levels. Therefore, a single BIA reading should be considered a snapshot, not a definitive measure. The real value of BIA scales lies in tracking trends over time, assuming you maintain consistent conditions (same time of day, similar hydration levels) for each measurement.
Tape measure formulas, like the US Navy method, offer a quick and inexpensive option, but they are also subject to error. Accuracy depends on precise measurements and consistent technique. Even slight variations in where you measure your waist, hips, and neck can lead to significant differences in the calculated body fat percentage.
Let's say Mark uses a BIA scale one morning after a strenuous workout and gets a reading of 15% body fat. Later that day, after a salty meal and minimal water intake, he measures again and gets 20%. This 5% swing isn’t a real change in body composition; it’s a result of fluctuating hydration levels. The lesson: don’t chase daily numbers. Focus on the overall trend over weeks or months, and use the same method and conditions each time.
11. Body Composition Analysis vs. Weight Loss: Why the Scale Isn't Always Your Friend
Many people equate weight loss with “success,” but this can be a misleading metric. The goal shouldn't be simply to lower the number on the scale, but to improve body composition – lose fat and preserve or even gain muscle. This is where focusing solely on weight can be detrimental.
Imagine Lisa starts a new exercise program and cleans up her diet. She begins lifting weights and eating more protein. Initially, she may not see a significant drop in weight. In fact, she might even gain a pound or two. This can be discouraging, but it doesn’t mean her efforts are failing. What’s happening is that she’s building muscle mass, which is denser than fat. Muscle weighs more, so gaining muscle can offset fat loss on the scale. This is why body composition analysis is so valuable. It allows you to track changes in fat mass and lean mass independently, providing a more accurate picture of your progress.
If Lisa measured her body fat percentage alongside her weight, she would see a decrease in percentage, even if her weight remained stable. She might also notice changes in her measurements, such as a smaller waist circumference and tighter clothing. These are all signs that she’s making progress, even if the scale isn’t reflecting it.
It’s crucial to shift your mindset from “weight loss” to “body recomposition.” This means focusing on building muscle, reducing body fat, and improving overall health, rather than chasing a specific number on the scale. A combination of regular exercise, a balanced diet, and consistent body composition tracking will yield far more meaningful and sustainable results.
12. Cost and Effort: Choosing the Right Tool for Your Budget and Commitment
The cost and effort required for accurate body composition assessment vary significantly depending on the method you choose. We’ve already established DEXA is the gold standard, but it comes with a price tag of $100-$300 per scan and requires access to a specialized facility. This makes it impractical for frequent monitoring for many people.
Hydrostatic weighing and Bod Pod are similarly expensive and require access to specialized facilities. Skinfold measurements, while less expensive (calipers cost around $20-$100), still require a skilled technician, adding to the cost ($30-$75 per session). The accuracy is highly dependent on the technician's skill.
BIA scales range in price from $50 to $300+. While convenient, they offer lower accuracy. Their main benefit is ease of use and the ability to track trends over time without needing to visit a facility. However, remember the importance of consistency – same time of day, hydration levels, etc. Tape measure methods are the most affordable (under $30 for a tape measure) but are also the least accurate and require careful technique for consistent measurements.
Consider your budget, your commitment to consistency, and your goals when choosing a method. If you're an athlete or bodybuilder who needs precise data, DEXA or hydrostatic weighing may be worth the investment. If you're simply looking to monitor your overall health and track trends, a BIA scale or tape measure method may be sufficient. Remember that consistency is key, regardless of the method you choose. Spending $100 on a fancy BIA scale won't yield accurate results if you're not using it consistently under the same conditions. A $20 tape measure, used correctly and consistently, can be more valuable in the long run.
FAQ
Can I have a high BMI but still be healthy?
Yes, this is common in individuals with high muscle mass, like athletes. Their weight is high for their height, but their body fat is low. In this case, body fat percentage is a much more accurate health indicator than BMI.
What is 'skinny fat' and how do I know if I am?
‘Skinny fat’ (or metabolically obese normal weight) means having a normal BMI and weight, but a high body fat percentage and low muscle mass. You’d identify this by getting a body composition analysis, as your weight and BMI would appear healthy.
How often should I measure my body fat percentage?
Measuring every 4-8 weeks is sufficient for tracking trends. Daily fluctuations in water weight can make more frequent measurements misleading. Consistency is key: measure at the same time of day, under the same conditions.
Are the body fat scales I buy for home use accurate?
Home body fat scales using Bioelectrical Impedance (BIA) are generally not highly accurate for a single reading. However, they can be useful for tracking the trend over time if you use the scale consistently (e.g., every morning after waking).
Is there one single best way to measure body fat?
DEXA scans are considered the ‘gold standard’ for accuracy, but they are expensive and not easily accessible. The ‘best’ method for you is a trade-off: DEXA for accuracy, calipers or tape measure for affordable trend tracking.
Does my ideal body fat percentage change as I get older?
Yes, it's normal and generally considered healthy for body fat percentage to gradually increase with age. Health charts for body fat percentage, like those from the American Council on Exercise, provide different ranges for different age groups.
Sources
- Centers for Disease Control and Prevention (CDC) — The standard BMI categories (Underweight, Normal Weight, Overweight, Obesity) and its use as a public health screening tool.
- World Health Organization (WHO) — The global definition of overweight and obesity using BMI for adults and its application in population-level surveillance.
- National Institute of Diabetes and Digestive and Kidney Diseases (NIDDK) — The health risks associated with being overweight or obese, such as type 2 diabetes, heart disease, and high blood pressure.
- Harvard T.H. Chan School of Public Health — Nuanced discussion on the limitations of BMI, including for different ethnicities and the 'obesity paradox'.
- The American Journal of Clinical Nutrition — The underlying science and comparative accuracy of different body composition measurement techniques, such as DEXA, BIA, and hydrostatic weighing.