How to Choose a Realistic Return Before Using an Investment Calculator
Your investment calculator is only as good as the numbers you feed it. Plug in a 12% annual return, and it’ll spit out a retirement nest egg that looks impossibly large. Use 5%, and you’ll panic about never being able to retire. The truth? Neither number is likely right for you.
Most investors make one of two mistakes: they either overestimate returns (leading to under-saving) or underestimate them (leading to unnecessary lifestyle sacrifices). The key is to build a personalized, realistic expected rate of return—one that accounts for your asset mix, inflation, fees, and future market expectations.
This guide will walk you through the process step by step. By the end, you’ll know exactly what number to plug into your investment calculator—and why.
Why Your 'Rate of Return' Guess Can Make or Break Your Financial Plan
Assume a 7% return over 30 years, and your $100,000 portfolio grows to $761,000. Drop that to 6%, and you end up with $574,000. That’s a $187,000 difference—just from a 1% change in your assumption.
The danger isn’t just in the math. Over-optimistic returns can lead to under-saving, forcing you to work longer or cut expenses in retirement. Over-pessimistic returns, meanwhile, might make you forgo investments you could afford, sacrificing quality of life unnecessarily.
Your investment calculator is a tool, not a crystal ball. The quality of its output depends entirely on the quality of your input. Guess wrong, and you’re planning for a future that doesn’t exist.
The Two Engines of Growth: Where Do Investment Returns Come From?
Investment returns come from two sources: income and capital appreciation. Income includes dividends from stocks and interest/coupons from bonds. Capital appreciation is the increase in the asset’s price over time.
The balance of these two sources varies by asset class. Growth stocks, for example, rely heavily on price appreciation, while bonds primarily provide income. Reinvesting that income—whether dividends or interest—is what drives compounding, which is what investment calculators model.
If you’re using an investment calculator, you’re counting on compounding to work in your favor. But that only happens if you’re realistic about both income and appreciation.
Setting the Baseline: What Has the Past Taught Us About Returns?
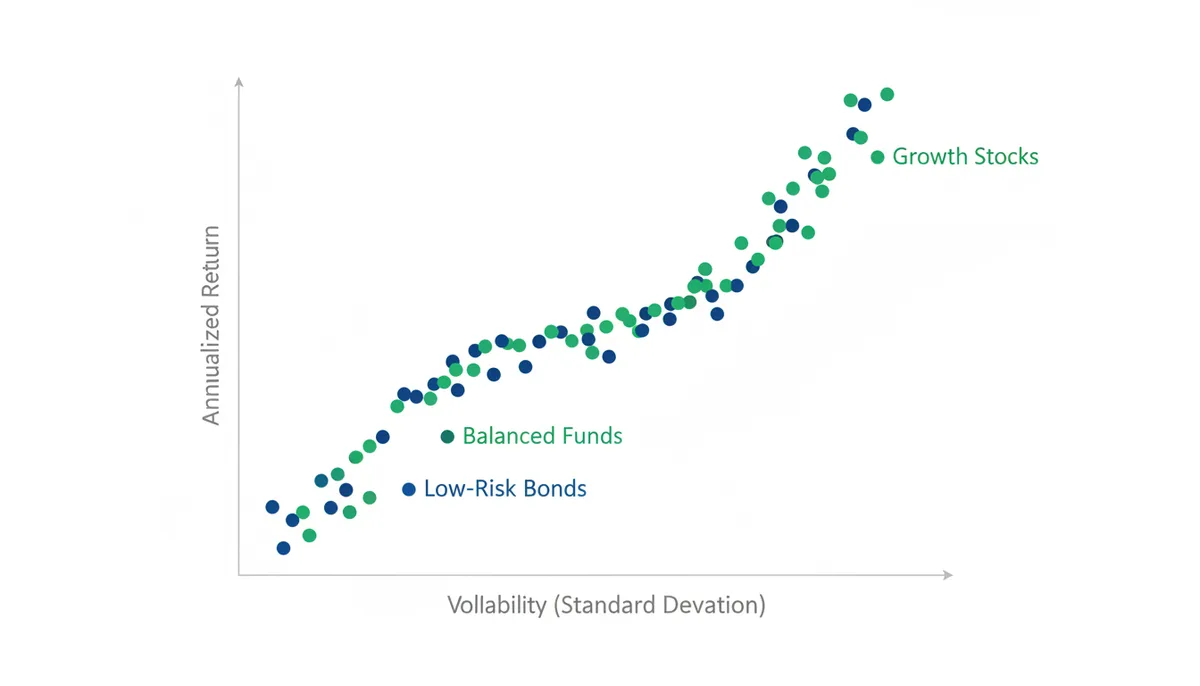
Historical returns are a starting point, not a guarantee. Here’s what the past 30 years (1993-2023) have shown for major asset classes, using total returns (including dividends) from NYU Stern's Aswath Damodaran's data, nominal and pre-fee:
| Asset Class | 30-Year Annualized Return (CAGR) | 30-Year Standard Deviation (Volatility) |
|---|---|---|
| US Stocks (S&P 500) | 9.8% | 15.5% |
| International Stocks (MSCI World) | 7.2% | 16.8% |
| US Bonds (Bloomberg US Aggregate Bond Index) | 5.1% | 8.5% |
| Gold (London PM Fix) | 3.8% | 19.2% |
Note the volatility (standard deviation) in the table. A 10% average return doesn't mean you get 10% every year—it means you get a wide range of outcomes that average out over time. That's the "price" of higher returns.
These numbers are pre-fee, pre-tax, and nominal (not adjusted for inflation). They're a starting point, not a final answer. For real returns, subtract the average inflation rate (about 2.5% over this period) from each figure.
Nominal vs. Real Returns: The Critical Impact of Inflation
Your investment calculator might show a 7% return, but that’s the nominal return—the headline number. The real return, which accounts for inflation, is what actually matters.
The formula is simple: Real Return ≈ Nominal Return - Inflation Rate. If inflation is 3%, a 7% nominal return becomes a 4% real return. That’s the actual purchasing power of your money.
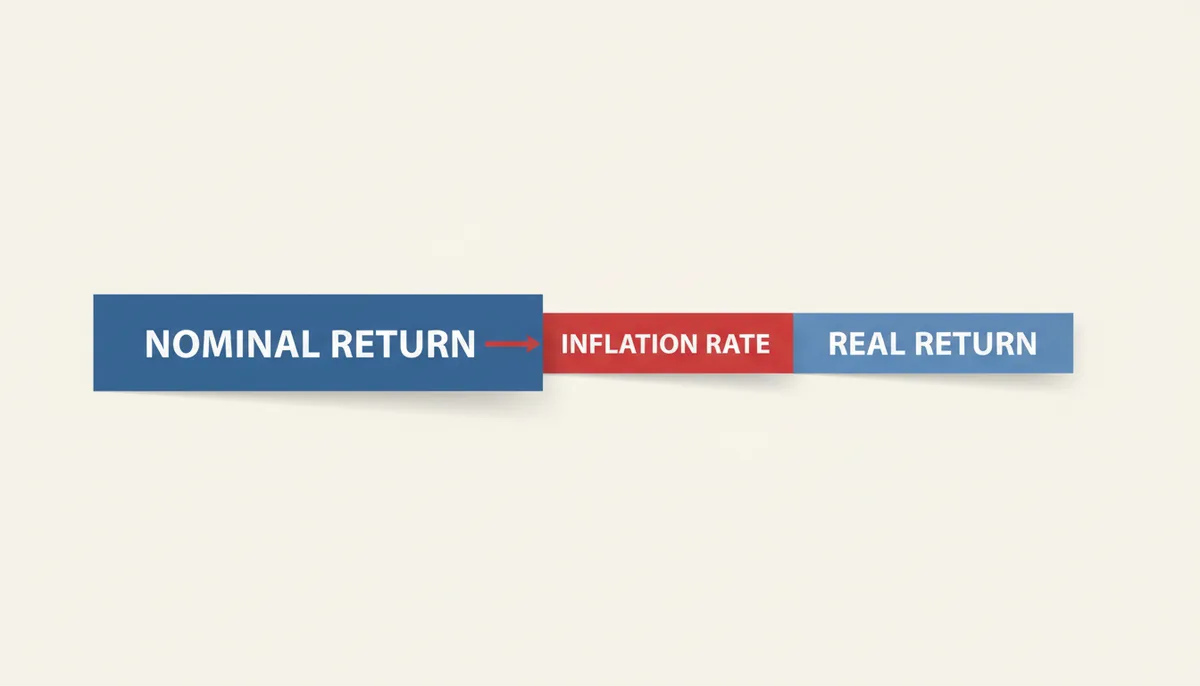
For long-term goals like retirement, planning with the real rate of return is essential. A 7% nominal return might sound great, but if inflation is 3%, you’re only gaining 4% in real terms. That’s a big difference over 30 years.
The Hidden Hurdles: How Fees and Taxes Reduce Your Net Return
Fees and taxes are silent return-killers. A 1% annual fee might not sound like much, but over 30 years, it can consume nearly 30% of your total wealth. That’s money you could have kept.
Common fees include:
- Mutual fund/ETF expense ratios (typically 0.1% to 1%)
- Advisory fees (often 1% of assets under management)
- Trading commissions (though these are less common now)
Taxes on capital gains and dividends also reduce returns. Using tax-advantaged accounts like a 401(k) or IRA can help mitigate this drag.
If you’re using an investment calculator, make sure to subtract fees and taxes from your expected return. Otherwise, you’re planning with an inflated number.
How to Calculate Your Personal Blended Return Rate
Your expected return isn’t a single number—it’s a weighted average based on your asset allocation. Here’s how to calculate it:
- Decide on your target asset allocation (e.g., 60% stocks, 40% bonds).
- Assign an expected return to each asset class (e.g., 9% for stocks, 4% for bonds).
- Multiply each asset’s expected return by its weight in your portfolio.
- Add them up for your blended return.
Example: A 60% stock, 40% bond portfolio with a 9% stock return and 4% bond return would have a blended return of (0.60 × 9%) + (0.40 × 4%) = 7.0%.
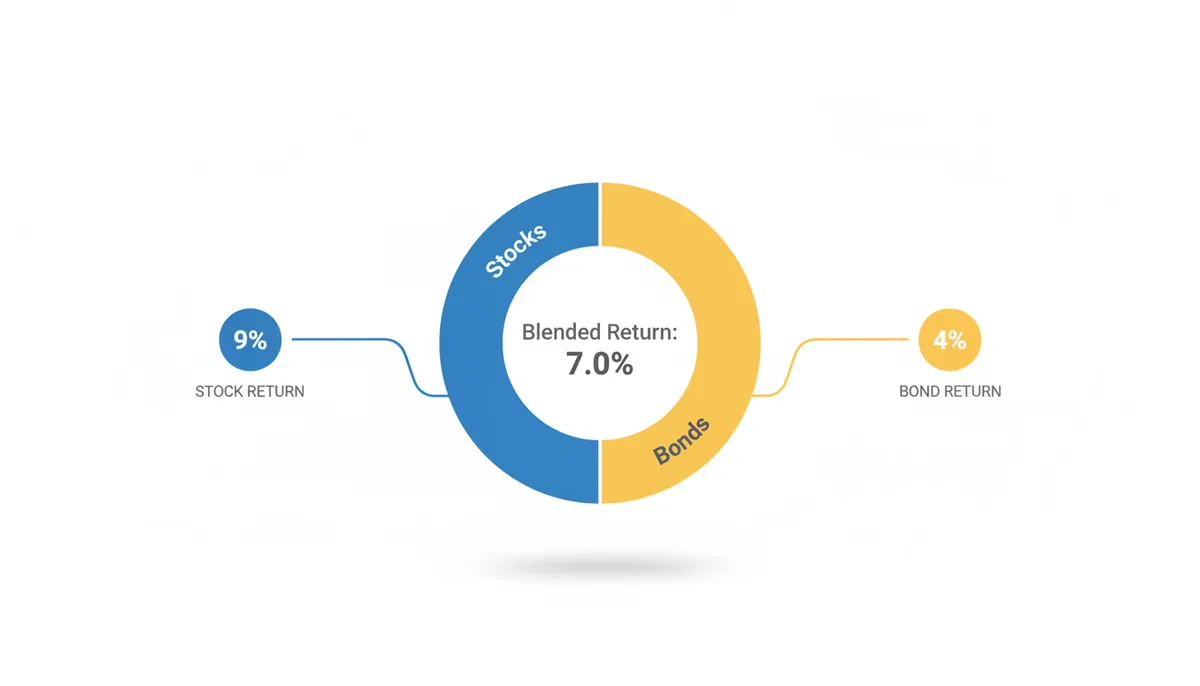
Run this calculation with your own numbers. It’s the only way to get a realistic expected return for your specific situation.
Looking Forward: Why the Future Might Not Look Like the Past
Historical returns are useful, but they're not a guarantee. Forward-looking return estimates from firms like Vanguard and BlackRock often differ from long-term averages. Here's why:
Current equity valuations (P/E ratios) and interest rates play a big role. If stocks are expensive (high P/E), future returns may be lower. If interest rates are low, bond returns may also be lower.
Here's how to estimate forward-looking returns using available data as of mid-2024:
| Asset Class | Historical 30-Year Annualized Return (1993-2023) | Forward-Looking Estimate (Example Methodology) |
|---|---|---|
| US Equities | 9.8% | 4.5-6.5% (Treasury yield + equity risk premium) |
| US Bonds | 5.1% | 3.0-4.5% (Current yield + expected roll-down) |
These estimates use:
- Current 10-year Treasury yield (4.3%) as the risk-free rate
- Historical equity risk premium (ERP) of 4.5-6.5% from NYU Stern data
- Current bond yields as a starting point for fixed income
These forecasts aren't gospel, but they're a crucial data point. Cross-check your historical assumptions against them to avoid over-optimism. For precise forward-looking estimates, consult the latest reports from Vanguard, BlackRock, or JPMorgan Asset Management.
Putting It All Together: Choosing a Defensible Number for the Calculator
Here’s how to pick a realistic return for your investment calculator:
- Start with historical averages for your asset classes.
- Subtract expected inflation (use 2-3% for long-term planning).
- Subtract fees (aim for 0.2-0.5% for low-cost index funds).
- Blend based on your asset allocation (use the method from the previous section).
- Sanity-check against forward-looking estimates.
For critical goals (like retirement), err on the side of a more conservative return. For aspirational goals, a moderate assumption may be appropriate.
Run the calculator three times: with a conservative rate, a moderate rate, and an optimistic rate. This gives you a range of possible outcomes.
Common Traps and Biases in Estimating Returns
Here are the biggest mistakes investors make when estimating returns:
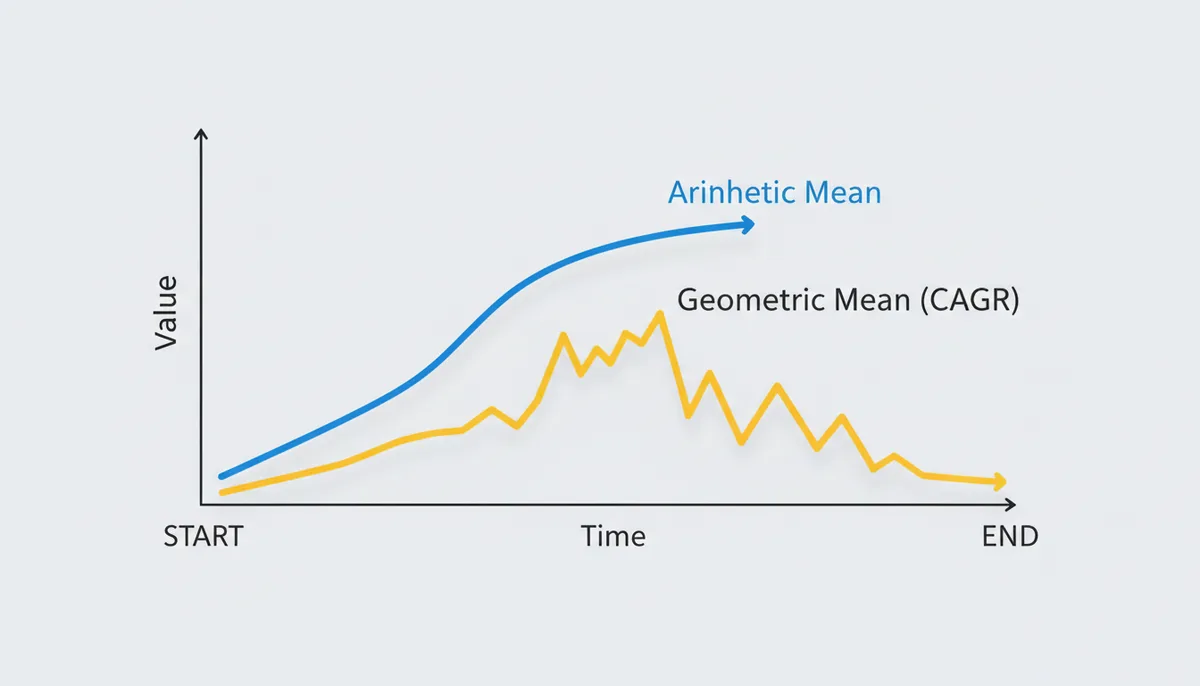
- Using arithmetic mean instead of geometric mean (CAGR). The arithmetic mean overstates returns because it ignores volatility. Use CAGR instead.
- Recency bias: Assuming the last few years’ returns will continue indefinitely. Markets don’t move in straight lines.
- Performance chasing: Basing future expectations on the best-performing asset class of the recent past. Diversification matters.
- Ignoring international diversification: US stocks have outperformed in recent decades, but that won’t always be the case.
- Forgetting to account for cash holdings: If you keep 10% in cash, your overall return will be lower than if you were fully invested.
- Using a pre-fee/pre-inflation number: Always adjust for fees and inflation to get a real, net return.
How to Adjust Returns for Your Risk Tolerance (Without Guessing)
Risk tolerance isn’t just about how much volatility you can stomach—it’s about how your portfolio’s returns might differ from the averages when markets get turbulent. A 60/40 portfolio might have a 7% expected return on paper, but if you panic and sell during a 20% drop, your actual return could be far worse.
Here’s how to account for behavioral risk in your return assumptions:
- Identify your risk profile. Use a risk tolerance questionnaire (like those from Vanguard or Fidelity) to determine if you’re conservative, moderate, or aggressive. This will guide your asset allocation.
- Apply a "behavioral discount". Research shows that investors underperform the market by about 1-2% annually due to emotional decisions. Subtract this from your expected return if you know you’re prone to panic-selling.
- Test your tolerance with historical downturns. Look at how your target allocation performed during the 2008 financial crisis or the 2020 COVID crash. Could you have stayed invested? If not, adjust your allocation (and expected returns) accordingly.
Example: If you’re a conservative investor with a 50/50 stock/bond portfolio, your blended return might be 5.5%. But if you know you’d sell during a 15% drop, reduce your expected return by 1-2% to account for potential mistakes. That 5.5% might become 4.0% in reality.
This isn’t about being pessimistic—it’s about being realistic. Your investment calculator should reflect your actual behavior, not just your idealized one.
The Hidden Cost of Cash: Why Holding Too Much Hurts Your Returns
Cash is the silent return-killer in most portfolios. It’s not just that cash earns almost nothing (0.1-0.5% in a high-yield savings account). The real damage comes from opportunity cost—the returns you miss out on by not being invested.
Here’s how much cash can hurt your long-term returns:
- If you keep 20% of your portfolio in cash over 30 years, you’re effectively reducing your overall return by about 0.8-1.2% annually, assuming a 7% stock market return.
- That 20% cash allocation could cost you over $200,000 in lost wealth over 30 years on a $500,000 portfolio.
- Even a "small" 10% cash allocation reduces your return by about 0.4-0.6% annually.
When should you hold cash? Only for:
- Short-term goals (within 1-3 years).
- Emergency funds (3-6 months of living expenses).
- Opportunistic buying (if you’re waiting for a market crash).
If you’re using an investment calculator, make sure to account for cash. Don’t assume your entire portfolio is invested—adjust your expected return downward if you’re holding a significant cash position.
How to Use Monte Carlo Simulations for More Realistic Planning
Investment calculators typically use a single expected return, but the future isn't that predictable. Monte Carlo simulations run thousands of possible market scenarios to show a range of outcomes, not just one.
Here's how to use them for more realistic planning:
- Input your asset allocation and expected returns. Use the blended return method from earlier to assign returns to each asset class.
- Set the number of simulations. More runs (e.g., 10,000) give a more accurate range of outcomes.
- Adjust for inflation and fees. Make sure your simulation accounts for real returns, not just nominal ones.
- Review the results. Look at the best-case, worst-case, and most likely outcomes. This will help you plan for downside risk.
Example: A 60/40 portfolio with a 7% expected return might have:
- A 90% chance of success (not running out of money) in retirement, assuming:
- 7% nominal return (5.5% real return, assuming 1.5% inflation)
- 4% annual withdrawals
- 30-year time horizon
- A 10% chance of a shortfall, even with a 7% return, due to sequence of returns risk
- A range of possible outcomes from 3% to 11% returns over 30 years, based on:
- Stock returns modeled with 10% average and 15% standard deviation
- Bond returns modeled with 5% average and 8% standard deviation
- Correlation of 0.3 between stock and bond returns
Monte Carlo simulations aren't perfect, but they're far more realistic than a single expected return. If you're using an investment calculator, consider running a Monte Carlo simulation alongside it to understand the range of possible outcomes. For precise simulations, use tools from Vanguard, Morningstar, or Portfolio Visualizer.
The Tax Drag: How Capital Gains and Dividends Reduce Your Returns
Taxes are the single biggest drag on investment returns for taxable accounts. Even if you’re in a low tax bracket, the cumulative effect of capital gains and dividend taxes can significantly reduce your long-term wealth.
Here’s how much taxes can hurt your returns:
- For a moderate-income investor in a 24% tax bracket, taxes can reduce after-tax returns by 0.5-1.5% annually, depending on your asset mix.
- For high-income investors (37% bracket), the drag can be 1.5-3% annually.
- Dividend taxes are especially damaging because they’re taxed annually, even if you reinvest them.
How to account for taxes in your return assumptions:
- Use tax-efficient funds. Index funds and ETFs tend to generate fewer capital gains than actively managed funds.
- Hold tax-inefficient assets in tax-advantaged accounts. Put bonds and high-dividend stocks in your IRA or 401(k).
- Use tax-loss harvesting. Offset gains with losses to reduce your taxable income.
- Adjust your expected return downward. Subtract 0.5-1.5% from your pre-tax return if you’re in a taxable account.
Example: If you expect a 7% pre-tax return and you’re in a 24% tax bracket, your after-tax return might be closer to 5.5-6.0%. That’s a big difference over 30 years.
If you’re using an investment calculator, make sure to account for taxes. Otherwise, you’re overestimating your future wealth.
How to Stress-Test Your Plan Against Market Crashes
Most investment calculators assume smooth, average returns. But the biggest risks to your financial plan come from market crashes, not the average year. Stress-testing your plan against historical downturns is the only way to know if you’re truly prepared.
Here’s how to do it:
- Pick a historical crash. The 2008 financial crisis (-50% in stocks) or the 1973-74 bear market (-45%) are good starting points.
- Apply it to your portfolio. If you had a 60/40 portfolio in 2008, how much would it have lost? (About 30% in that year alone.)
- See if you could stay invested. If you would have panicked and sold, your actual returns would have been far worse.
- Adjust your plan accordingly. If a 30% drop would derail your goals, you may need to save more, reduce spending, or adjust your asset allocation.
Example: If you’re 10 years from retirement and a 30% drop would force you to delay retirement, you might:
- Reduce your stock allocation to 50%.
- Increase your savings rate by 5%.
- Extend your time horizon by 2 years.
Stress-testing isn’t about being pessimistic—it’s about being prepared. Your investment calculator should reflect the worst-case scenarios, not just the average ones.
FAQ
Is the historical S&P 500 return of ~10% a good number to use in a calculator?
It’s a common starting point, but it’s too simplistic. You must adjust it for inflation, fees, and your personal mix of other assets like bonds. A realistic net, real return is often closer to 4-6%.
How does my time horizon affect the return I should expect?
A longer time horizon (10+ years) allows you to ride out market volatility, making it more reasonable to use long-term average returns for equities. For short-term goals (under 5 years), you should assume a much lower, more conservative return, as you have less time to recover from a downturn.
How often should I re-evaluate my expected rate of return?
You should review your assumptions annually or whenever you significantly change your asset allocation. Major market shifts or changes in expert forward-looking guidance are also good triggers for a review.
Should I use a different rate of return for my retirement calculator vs. a general investment calculator?
Yes, potentially. For a critical goal like retirement, it’s wise to use a more conservative rate of return to ensure you are saving enough. For a more flexible goal, you might use a slightly more moderate rate.
My investment app shows a 'total return' of 15% this year. Can I just use that?
No, you should not use a single year’s return. Short-term performance is highly volatile and not a reliable predictor of long-term results. Use a blended, multi-decade average, adjusted for fees and inflation, for more realistic planning.
Does a higher risk tolerance mean I should use a higher expected return?
Not directly. A higher risk tolerance means you are comfortable with an asset allocation that has a higher *potential* return (e.g., more stocks). You would then calculate your expected return based on that aggressive allocation, rather than just picking a higher number out of thin air.
Sources
- U.S. Securities and Exchange Commission (SEC) — Definitions of investment products (ETFs, mutual funds), explanations of fees and expenses, and official guidance on the principles of risk and diversification.
- Financial Industry Regulatory Authority (FINRA) — Information on investment fees, fund analyzers, and investor education materials that back up claims about the impact of costs on returns.
- U.S. Bureau of Labor Statistics (BLS) — Official source for the Consumer Price Index (CPI) data, used to calculate the rate of inflation and adjust nominal returns to real returns.
- NYU Stern School of Business (Aswath Damodaran) — Authoritative public data sets on historical returns for various asset classes (stocks, bonds, etc.), risk premiums, and corporate finance statistics. Supports the section on historical baseline returns.
- Federal Reserve Economic Data (FRED) — Primary source for a wide range of economic data, including historical interest rates for U.S. Treasury securities (the risk-free rate) and inflation metrics.