How to Use a Mortgage Calculator Before You Talk to a Lender
A pre-approval letter answers exactly one question: what's the most a bank will lend you. It says nothing about what you should borrow. Those two numbers are routinely $50,000 to $100,000 apart, and the gap between them is where buyers get into trouble — or discover, after six weekends of touring homes, that the price range they'd fallen in love with was never realistic.
Most people use a mortgage calculator to get one number, nod, and close the tab. Used properly, it does much more: it builds you a set of stress-tested payment scenarios and turns you into the most prepared person in the room when you finally sit down with a loan officer. Here's the full procedure, from gathering inputs to walking into pre-approval with a written list of questions.
Why Your First Conversation Shouldn't Be With a Lender
Lenders aren't being sneaky when they approve you for more than you should spend. Their math is mechanical: they look at your debt-to-income ratio, and many will approve you with total monthly debts running up to around 43% of your gross income — sometimes higher with strong compensating factors. What doesn't appear in that math is your childcare bill, your retirement contributions, your aging car, or the fact that you like eating out. The lender's ceiling is a legal maximum, not a lifestyle recommendation.
A calculator session is the opposite environment. It's anonymous, free, and involves no credit check and no follow-up phone calls. Nobody is steering you toward a product. You can type in your real numbers, be honest about your spending, and see what a $2,500 monthly payment actually does to your month — in private, at your own pace.
Buyers who skip this step tend to fail in one of two directions. The first group takes the pre-approval amount as a target, buys at the ceiling, and ends up house-poor — owning a beautiful home they can't afford to furnish or vacation away from. The second group anchors on a dream listing, then gets pre-approved for less and feels crushed by a number they never tested in advance. An evening with a calculator prevents both.
The goal isn't to find a number the internet thinks you can afford. The real question behind "how much house can I afford" is "how much monthly payment can I absorb without flinching" — and you're the only one who can answer it. Set your own ceiling first. Then let the lender's number simply confirm it.
Gathering Your Inputs: The Numbers You Need Before You Calculate
Spend an hour here. The calculator takes ninety seconds to run; the inputs are where accuracy lives. A mortgage calculator with garbage inputs gives you a garbage payment with false confidence attached.
- Home price. Pull 10 to 15 real listings — active and recently sold — in your target neighborhoods and pick a realistic midpoint. Don't model the prettiest house you've bookmarked. Model the house you'd actually end up buying.
- Down payment. This is the cash you can truly commit, which means your savings minus closing costs (typically 2% to 5% of the loan amount), minus moving costs, minus a genuine emergency fund of three to six months of expenses. If doing that arithmetic leaves you at 12% down instead of 20%, model 12%. Emptying every account to hit 20% and then having the water heater die in month two is a classic first-year disaster.
- Interest rate. Major financial news outlets publish daily average rates for 30-year fixed mortgages — use that average as your baseline. Know that the advertised rate assumes strong credit, a solid down payment, and sometimes prepaid discount points. Your actual quote could be half a point higher or lower depending on your credit score, loan type, and loan-to-value ratio. That's why you'll stress-test it later.
- Loan term. 30 years is the default for a reason; 15 years costs far less in total but demands a much bigger monthly payment. You'll compare them head-to-head before you're done.
Then come the pieces of the monthly payment that buyers most often forget, the "T and I" in PITI:
A Real Run-Through: How One Buyer Stress-Tested a $380,000 Budget
Marcus and Dana are 28 and 30, living in a mid-size city, with a combined gross income of $92,000. They’ve saved $52,000. They think they can afford a $380,000 house because a listing site’s tiny mortgage widget showed an “estimated payment” of $2,400. They open a real mortgage calculator and start from zero.
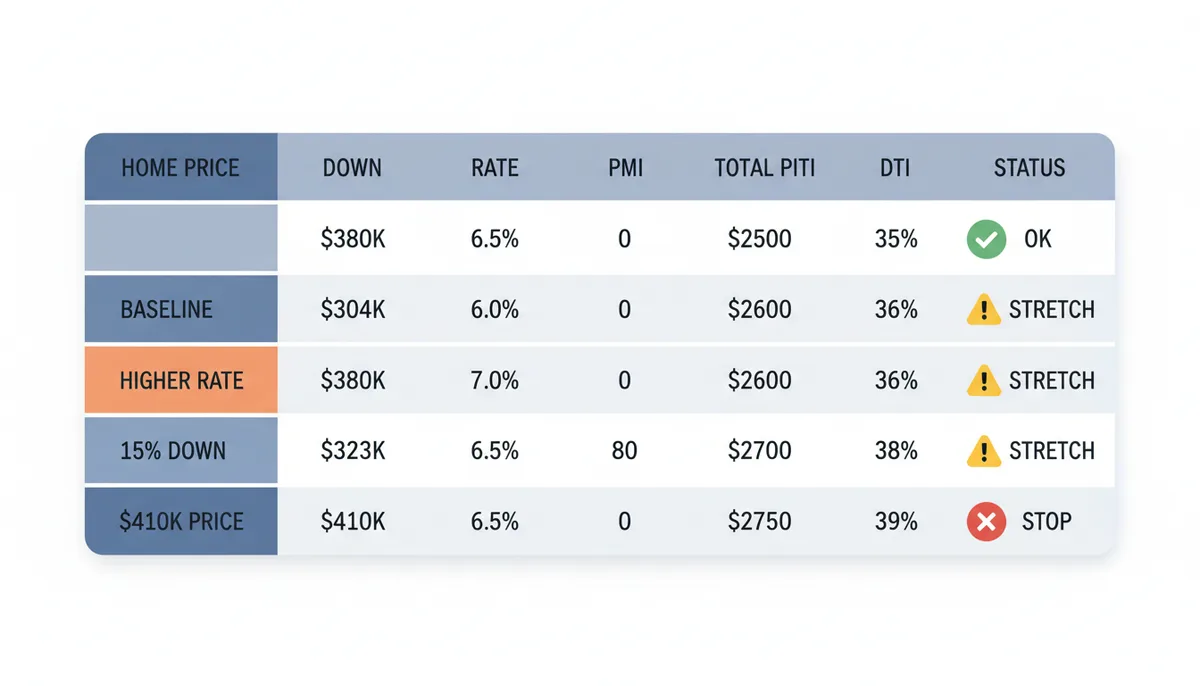
Home price: $380,000. Down payment: $38,000 — ten percent — which leaves them a $14,000 cash cushion after estimated closing costs. Loan amount: $342,000. Interest rate: 6.75%, the daily average they pulled from a financial news site that morning, not the 6.25% teaser in a lender’s mailer. Term: 30 years. Property taxes: the county mill rate is 22.5 mills, and since the sale will likely trigger reassessment to near the purchase price, they estimate $7,125 annually, or $594 a month. Homeowners insurance: a quick quote for a frame house of that age comes back at $1,320 a year, or $110 a month. PMI: with 10% down, they estimate 0.55% of the loan balance annually, which is $1,881, or roughly $157 a month.
The baseline PITI is $2,893. Principal and interest alone are $2,218. That is already $493 above the listing site’s fantasy number, which omitted PMI and used a lower rate. They feel the first real sting.
Next, they stress-test. Dana’s credit score is 695. What if the lender’s actual offer is 7.75%? They change one field. P&I jumps to $2,447, and the total payment hits $3,208. That is 42% of their gross monthly income of $7,667, before utilities, groceries, or the $380 student loan minimum that still shows up on their credit report. They mark this scenario red.
Then they test a larger down payment. At 15% down — $57,000 — the loan drops to $323,000 and PMI falls to about $110 a month. The total payment sinks to $2,762. But reaching 15% would drain their liquid savings to roughly $8,000 after closing. They calculate the break-even on that extra $19,000: $131 in monthly savings divided into $19,000 equals 145 months, or twelve years. They decide to stay at 10% and accept the PMI.
They also check the amortization schedule. In year one, they will pay roughly $22,900 in interest and reduce principal by only $4,100. If they move in year three, they will have barely built equity beyond their down payment. That kills any notion of escaping PMI quickly through appreciation.
Finally, they test price sensitivity: the same house in the better school district is $410,000. Taxes rise, PMI rises, and the total payment hits $3,147. They set a hard ceiling of $380,000 unless rates drop below 6.25%. They walk into the lender with three numbers — a comfortable target ($2,893), a stretch limit ($3,050), and an absolute stop ($3,200) — plus a list of questions. The calculator did not give them permission to buy. It gave them a script.
How Lenders Actually Calculate DTI (And Why Your Calculator Payment Is Only Half the Story)
A mortgage calculator tells you what the house costs. A lender tells you whether you are allowed to pay it. The gap between those two outcomes is almost always your debt-to-income ratio, and most buyers calculate it wrong because they look only at the house.
Lenders split DTI into two numbers. The front-end ratio is your total housing payment — PITI plus HOA fees — divided by your gross monthly income. Conventional underwriters often want this under 28%, though automated underwriting systems can stretch it. The back-end ratio is what actually kills deals: total monthly debt obligations divided by gross income. That includes the new mortgage, your car payment, student loans, minimum credit card payments, alimony, and child support. The typical ceiling is 36% for conservative approval, 43% for standard, and up to 50% with strong compensating factors and an automated approval.
Here is where the calculator betrays you. You run a scenario: $380,000 home, 10% down, PITI of $2,893. Your household gross is $7,667 per month. The front-end ratio is 37.7%. You think, “That is fine, I have heard 43%.” But you also have a $420 car payment, $380 in student loans, and $150 in credit card minimums. The lender may not use your $250 income-based repayment amount; Fannie Mae generally allows the documented IBR payment, but Freddie Mac and some other programs may apply a higher calculated amount, such as 0.5% of the outstanding balance. On a $60,000 loan, that is the difference between $250 and $300. Back-end total: $3,843. That is 50.1%. Even with excellent credit, a manual underwriter will flag this.
The self-test is simple and should be done before you ever touch the mortgage calculator. Add up every minimum monthly payment that appears on your credit report. Add the proposed PITI. Divide by your gross monthly income — the number before taxes, not your take-home. If you are over 43%, your first job is not finding a cheaper house; it is eliminating a debt or increasing income. A $380 car payment costs you roughly $45,000 in purchase price at 6.75% interest. Paying off that car before applying is often the single biggest move you can make.
There is a further layer: non-debt obligations that feel like debt. Lenders do not count daycare, health insurance premiums, or 401(k) contributions in DTI. But you should. A family paying $1,400 a month in childcare and modeling a 43% back-end DTI will feel financially crushed even if the lender signs off. Run two ratios: the lender’s formal one, and your real one that includes the obligations that keep you awake. Use the lower of the two as your budget. The calculator can handle the house; only you can handle the household.
The ARM Time Bomb: How to Model the Adjustment Correctly
The 5/1 Adjustable-Rate Mortgage looks like a bargain. The spread between a 30-year fixed and a 5/1 ARM can sit around one full percentage point. On a $360,000 loan, that is roughly $240 a month in savings for the first five years — nearly $15,000 in total. The catch is that years six through thirty are a blind bet on interest rates, and most buyers model them as if they will refinance before the hammer drops. A proper calculator session treats the ARM as two separate loans and demands you survive the second one.
An ARM is structured as an index plus a margin. The index might be the Secured Overnight Financing Rate or the one-year Constant Maturity Treasury. The margin is fixed, often 2.75% to 3.00%. If the index is 5.1% at adjustment, your new rate is 7.85%. The initial rate of 5.75% was a marketing number; the real math starts there. Most ARMs have three caps: an initial adjustment cap (commonly 2% or 5%), a periodic adjustment cap (typically 2%), and a lifetime cap (usually 5% over the start rate). A 5/1 ARM with a 2/2/5 cap structure starting at 5.75% can hit 7.75% in year six, 9.75% in year seven, and top out at 10.75%.
Run those payments on a $360,000 remaining balance. At 5.75%, principal and interest are $2,101. At 7.75%, they rise to $2,583. At 9.75%, they hit $3,096. Your total housing payment could jump from $2,800 to $3,800 inside of two adjustment periods. If your back-end DTI was already near 43% at the teaser rate, you are now in default territory.
The honest way to model this is to calculate the worst-case payment in year six and plug it into your budget stress test. Do not compare the ARM’s initial payment to the fixed rate. Compare the ARM’s worst-case payment to the fixed rate. If you cannot comfortably afford the 7.75% or even 9.75% scenario, the ARM is not saving you money; it is renting you a lower payment for five years in exchange for catastrophic risk later.
The “I will just refinance” exit strategy assumes three things: your home will have appreciated enough to give you equity, your income will be stable or higher, and market rates will have fallen. In 2009 and again in 2023, millions of homeowners discovered that all three assumptions could fail simultaneously. Use the calculator to model the ARM as if you are stuck with it for thirty years. If the fixed-rate payment is only $200 more and you sleep better, pay the premium. The ARM only makes sense if the spread is wide — say, 1.5 percentage points or more — and you have a concrete, non-housing reason to sell within five years, like a military transfer or a known job relocation.
PMI, MIP, and the 20% Myth: When Putting Less Down Actually Wins
Conventional wisdom says 20% down is the only responsible way to buy a house. It is not wrong, but it is not universally right. The 20% threshold matters because it eliminates Private Mortgage Insurance, but the insurance itself is often cheaper than the opportunity cost of draining your savings or missing years of market appreciation. The calculator lets you run the three-way race: big down payment, small down payment with PMI, or a piggyback loan.
PMI on a conventional loan typically runs 0.3% to 1.5% of the original loan amount annually, with the rate determined by your credit score, loan term, and loan-to-value ratio. LTV is simple division: loan amount divided by appraised value. A $360,000 loan on a $400,000 home is 90% LTV. A buyer with a 740 score putting 10% down on a $400,000 home might pay 0.44%, or $1,584 a year — $132 a month. That is real money, but it is not forever. Under the Homeowners Protection Act, lenders must automatically cancel PMI when your principal balance reaches 78% of the original value through normal amortization. You can also request cancellation at 80% LTV, though the lender may require an appraisal. On a 30-year loan at 7%, a borrower starting at 90% LTV hits 80% after roughly month 72 — six years. If home values rise, you can get there faster.
Then there is FHA, which is not the same game. FHA loans require an upfront Mortgage Insurance Premium of 1.75% of the loan amount, rolled into the balance, plus an annual MIP that often exceeds PMI rates and, for 30-year loans with less than 10% down, typically lasts the life of the loan. You can only escape by refinancing into a conventional loan later, which costs thousands and depends on future rates and equity. The FHA calculator payment looks affordable at first, but the lifetime cost dwarfs conventional PMI.
A third option is the piggyback or 80/10/10 structure: 80% first mortgage, 10% home equity line of credit, 10% down. No PMI. But the HELOC is usually variable-rate, and after any introductory period it can jump above your first mortgage rate. If the HELOC hits 9% while your first mortgage sits at 6.75%, the combined monthly cost can exceed old-fashioned PMI.
Use the calculator to compare the ten-year total cost. Option A: 20% down, no PMI, lower loan amount, but $60,000 less in your investment account. Option B: 10% down, $132 monthly PMI for six years, but that $60,000 stays invested at 5%. Option C: FHA with 3.5% down and permanent MIP. In most markets, Option B wins if your investment return exceeds the PMI cost and you need liquidity. The 20% rule is a safe default, but safety is not free. The calculator exposes the price tag.
The Property Tax Trap: Why Your Estimate Could Be Off by Thousands
Mortgage calculators default to a national average for property tax — often around 1.1% of home value annually — and that single assumption can destroy your budget. Property tax is not a national market. It is a hyper-local stack of mill levies, assessment ratios, special districts, and reassessment rules that can double the number between one side of a street and the other.
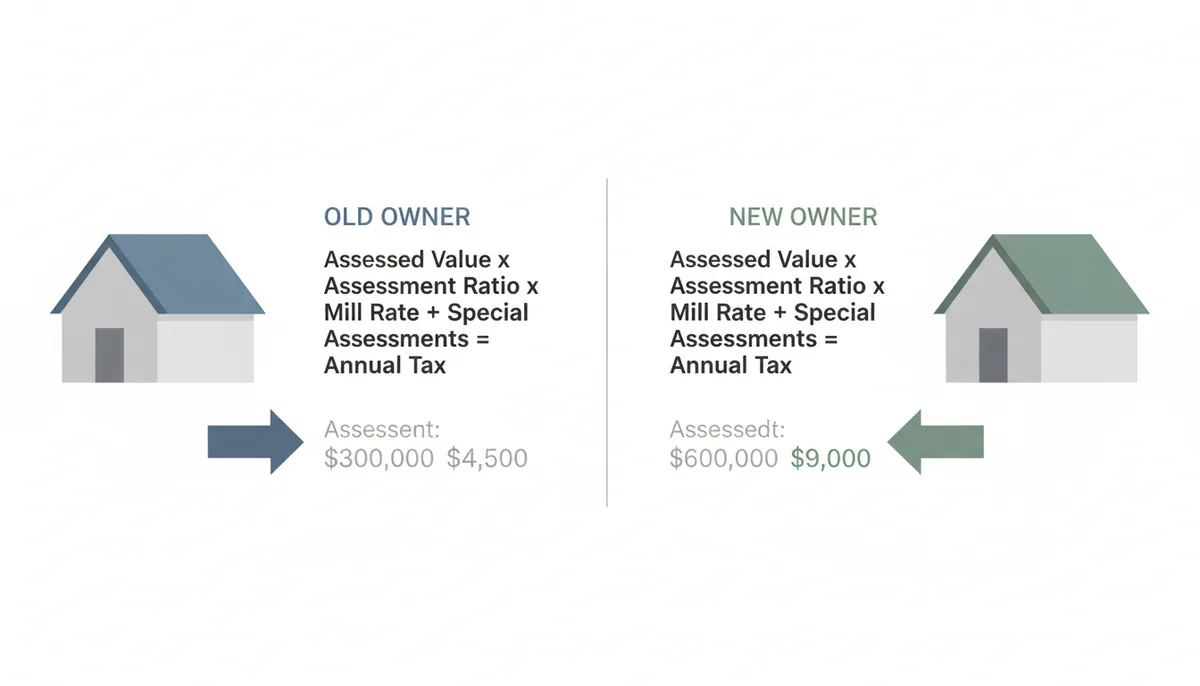
Start with the mill rate. One mill equals $1 in tax for every $1,000 of assessed value. A county with a total mill levy of 18 mills charges $18 per $1,000. But assessed value is not sale price. Some jurisdictions assess at 100% of market value; others assess at 10%, 35%, or 70%, then use correspondingly higher mill rates to reach the same dollar amount. If you see a low rate like 0.7%, check whether it applies to full value or a fraction. A buyer moving from a 10% assessment state to a 100% assessment state who ignores the difference will underestimate by a factor of ten.
The bigger shock comes at sale. In many jurisdictions, the taxable value is capped for existing owners — California’s Proposition 13 limits annual increases to 2% — but resets to the purchase price when the home sells. A house taxed at $4,200 under the old owner could jump to $8,000 for you. The listing site’s tax history is a trap; it shows the previous owner’s privileged rate, not your future bill. You must look up the local assessor’s formula and apply it to the price you will actually pay.
Then there are special assessments. In California, Mello-Roos districts finance infrastructure through bonded debt attached to the property tax bill. In Texas, Public Improvement Districts do the same. In Colorado, Metropolitan Districts operate similarly. These are not optional HOA fees; they are property taxes collected by the county, often running $200 to $600 monthly on top of base rates. They rarely appear in national calculator defaults. Insurance has similar regional cliffs. A home in FEMA flood zone AE requires a separate flood policy that can add $1,500 to $3,000 annually. Windstorm coverage in coastal counties can double a standard premium. Wildfire risk zones in the West trigger surcharges, and in California, a separate California Earthquake Authority policy can add thousands if your lender requires it.
The only accurate way to model this is to research the specific parcel. Call the county tax collector with the address. Ask whether the sale triggers reassessment. Search the tax bill for line items labeled “special assessment,” “Mello-Roos,” or “bond.” Get an insurance quote for that exact address, not a ZIP-code average. Most calculators let you override the default; if the one you are using does not, find one that does, because the auto-populated figure is a fiction. Your escrow account demands reality.
Points, Lender Credits, and the Break-Even Bet
A lender quotes you two options on the same $360,000 loan: 6.75% with no points, or 6.375% if you pay one discount point at closing. The point costs $3,600. The monthly payment drops from $2,334 to $2,245 — a savings of $89. The break-even is $3,600 divided by $89, which equals 40.4 months. If you sell or refinance before three and a half years, you gave the bank an interest-free loan for nothing. If you stay seven years, you more than double your money. The calculator’s amortization schedule is the only way to see this clearly, but most buyers never run the numbers because they assume points are either always smart or always a scam.
The break-even math gets more nuanced when you factor in taxes. Discount points on a purchase mortgage are generally deductible as prepaid interest in the year you pay them, subject to IRS limits and itemization requirements. If you are in the 22% federal bracket, that $3,600 point effectively costs you $2,808 after tax, shrinking your break-even to 31.5 months. But if the standard deduction exceeds your itemized deductions, the tax benefit vanishes. You have to know your own tax posture.
The mirror image is a lender credit. You accept a higher rate — say, 7.125% — and the lender covers $3,000 of your closing costs. The payment rises by $97 a month, but you keep cash in hand at the exact moment you need it most. This is rational if you expect to move within three years, or if you are buying a fixer-upper and need the cash for immediate repairs. It is disastrous if you stay fifteen years; the extra interest totals over $17,000.
Sources
- Consumer Financial Protection Bureau (CFPB) — Definitions of PITI, APR, Loan Estimate, Closing Disclosure, and DTI ratio, as well as the overall home buying process and consumer rights.
- U.S. Department of Housing and Urban Development (HUD) — Official information and requirements for FHA loans, including minimum down payment and mortgage insurance rules.
- U.S. Department of Veterans Affairs (VA) — Authoritative details on VA loan eligibility, benefits, and the 0% down payment option.