Why a Calorie Calculator Result Is a Starting Point, Not a Meal Plan

You Have a Number. Now What?
You typed in your age, height, weight, and "moderately active" and the calculator gave you 2,100 calories. You stare at the number and wonder if that is the answer. It is not a prescription. It is a hypothesis built from population averages, and your job now is to test it.
Most people treat the output like a rule: eat exactly that and lose weight. When the scale does not move, they assume they failed. More often the calculator failed to capture you. The number is a sensible place to start because it gives you a consistent baseline, not because it is true for you.
Think of it as the first experiment in a personal series. You will hold calories steady, collect real data on how your body responds, and then adjust. That loop, not the initial estimate, is what gets you to your true maintenance calories. The rest of this guide is the method for running that experiment without guessing.
How Do Calorie Calculators Actually Work?
Every online calorie calculator does the same two-step math, even if the interface looks different. First it estimates your Basal Metabolic Rate, BMR. BMR is the energy you would burn if you lay in bed all day. It is estimated from age, sex, height, and weight using equations like Mifflin-St Jeor, Harris-Benedict, or Katch-McArdle. Mifflin-St Jeor is the most common now because it tends to be closer for average adults.
Second, the calculator multiplies that BMR by an activity factor. The factors are usually 1.2 for sedentary, 1.375 for light activity, 1.55 for moderate, 1.725 for very active, and 1.9 for extra active. That product is labeled Total Daily Energy Expenditure, TDEE. TDEE is the estimate of how much you burn in a day with your current life. The concept of activity multipliers and physical activity levels is covered by exercise professionals and guidance on activity categories supports this approach, since "moderately active" can mean very different things in practice (ACE).
Both steps introduce error. The BMR equations were derived from groups of people, not you. The activity multiplier is a blunt label. "Moderately active" means different things to different people. One person walks 8,000 steps and does two gym sessions. Another lifts hard three times a week and sits the rest of the day. Same label, different burn.
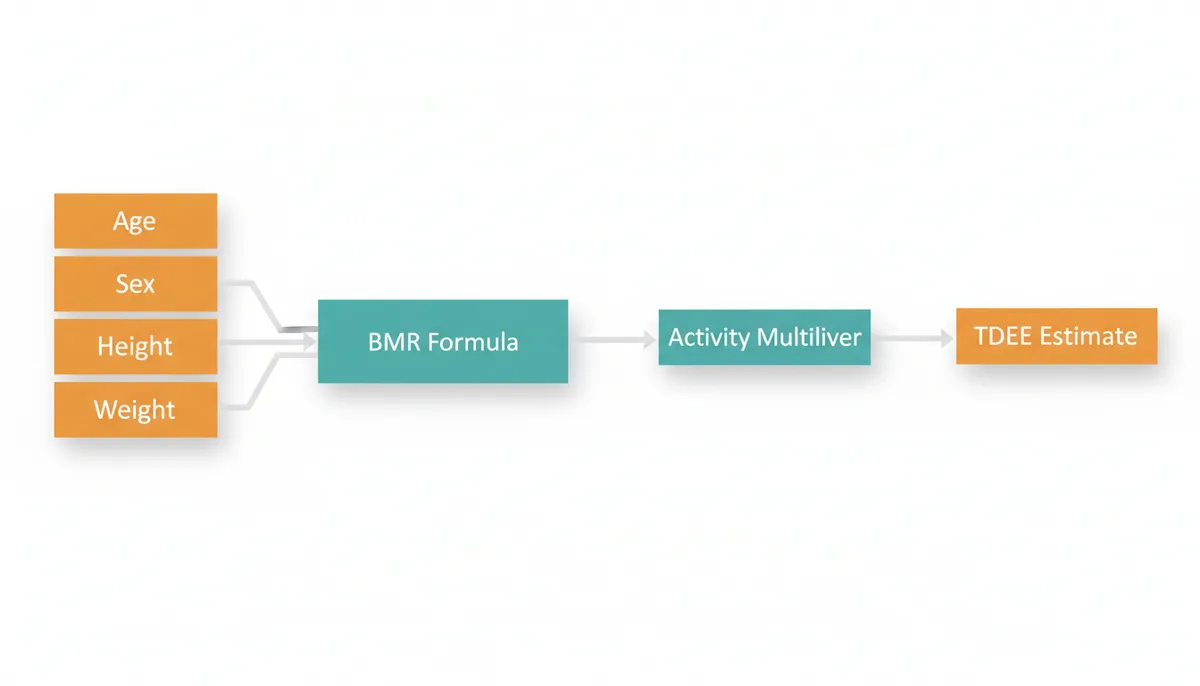
I would pick one equation and stick with it for your first test. Mifflin-St Jeor is fine. Katch-McArdle uses lean body mass instead of total weight and can be more accurate if you know body fat percentage from a reliable method. The point is consistency, not perfection. You are not trying to find the perfect formula. You are trying to find your actual response to a set intake.
Why Your Body Isn't a Formula: The Variables Calculators Miss
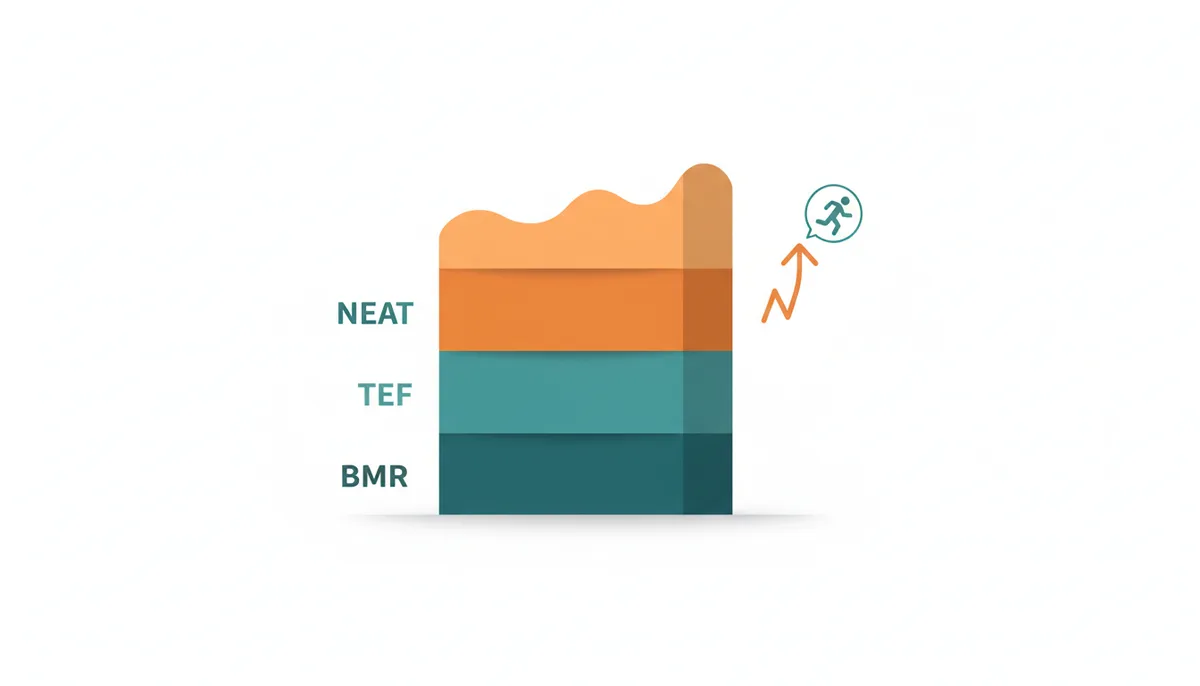
TDEE is made of four parts. BMR is the largest. Thermic Effect of Food, TEF, is the energy cost of digesting food, roughly 10 percent of intake. Exercise Activity Thermogenesis, EAT, is the formal workouts you log. Non-Exercise Activity Thermogenesis, NEAT, is everything else: fidgeting, standing, walking to the kitchen, carrying groceries, pacing on calls.
Calculators can guess BMR and they can ask about EAT. They cannot see NEAT. NEAT varies dramatically between people and even within the same person week to week. Two people with identical stats can differ by 300 to 500 calories a day just from unconscious movement. That is the part that makes formulas unreliable.
Other things formulas miss are harder to quantify. Genetics influence resting metabolism. Hormonal health matters. Thyroid function, cortisol patterns, sleep quality, and menstrual cycles all shift energy needs. Diet history matters too. If you have been in a long deficit, your body adapts by becoming more efficient. That is metabolic adaptation. It lowers NEAT, changes hunger signals, and makes the old calculator number too high for weight loss (metabolic adaptation).
Body composition is another blind spot. Muscle burns more at rest than fat. A calculator that only knows weight cannot know if 180 pounds is mostly muscle or mostly fat. That is why Katch-McArdle can help when you have a decent estimate of lean mass.
An analogy helps. A car’s EPA MPG rating is the calculator. Your real mileage depends on driving habits, tire pressure, hills, and weather. The rating is useful to compare cars. It is not a promise about your next tank.
Your First 2-4 Weeks: Establishing a Personal Baseline
Pick a calorie target from the calculator and hold it. Do not change your training or your step goal during this window. The goal is clean data.
Two to four weeks is enough to see a trend without the noise of water shifts overwhelming you. Four weeks is better if your schedule is irregular. Track intake with a food scale for at least the first week. Eyeballing portions is the most common source of error. Apps make logging faster, but the scale makes it honest.
Keep protein consistent. A common heuristic is 0.7 to 1.0 grams per pound of body weight for most adults, higher if you train hard. Keep carbs and fats varied within reason, but avoid big swings in intake that create water fluctuations. Weigh and log at the same time each day.
If you already have a calorie number from CalculatorLine.com's Calorie Calculator, use that as your starting point for this test. Write it down. This is your hypothesis.
Do not try to be perfect every day. Aim for weekly average consistency. One higher day will not ruin the experiment if the average holds. The mistake people make is changing the target every few days because the scale moved. That is like changing the recipe before the cake is baked.
How to Track What Really Matters (It's Not Just the Scale)
Weigh yourself daily, first thing in the morning, after using the bathroom, before eating. Use the same scale on a hard floor. Daily weight bounces up and down with water, salt, carbs, and hormones. A single day up 1.5 pounds after a salty dinner means nothing.
Use a weekly average. Add the seven daily weights and divide by seven. Compare week to week, not day to day. That smooths noise and shows the real trend.
Scale weight can stall even when body composition is improving. If you are training hard, you may lose fat and gain muscle at the same time. The scale hides that. Add measurements. Waist at the navel, hips at the widest point, and chest or thigh depending on your goals. Measure once a week, same time of day.
Progress photos help. Take front, side, back photos every two weeks in the same lighting, same pose, same time. Visual changes show up before the scale moves.
Subjective metrics matter for adherence. Rate energy, sleep quality, hunger, and workout performance on a 1 to 5 scale each day. If energy crashes for two weeks straight, the target is too low even if weight is dropping.
| Day | Daily Weight lb | Daily Calorie Intake | Notes |
|---|---|---|---|
| Mon | 180.2 | 2100 | Sleep 7h |
| Tue | 179.8 | 2050 | Leg workout |
| Wed | 180.5 | 2150 | High salt meal |
| Thu | 180.0 | 2080 | Rest day |
| Fri | 179.6 | 2120 | Walk 8k steps |
| Sat | 180.3 | 2200 | Brunch out |
| Sun | 179.9 | 2070 | Light walk |
| Weekly Average | 180.0 | 2110 |
The Adjustment Protocol: How to Steer Your Progress
After two to three weeks of consistent intake, look at the weekly average trend. Is weight moving in the direction you want at a reasonable pace? For fat loss, 0.25 to 0.5 percent of body weight per week is a sustainable range. For someone 180 pounds, that is about 0.5 to 0.9 pounds per week.
If the trend matches your goal, stay the course. Do not change anything. Collect another two weeks of data.
If weight is stable and you wanted loss, you are at maintenance for that intake. If weight is going up and you wanted loss, you are above maintenance. Adjust down. If weight is dropping too fast and you feel run down, adjust up.
Make small changes. Add or subtract 100 to 250 calories per day. Large cuts feel punishing and increase muscle loss risk. Small changes are easier to sustain and easier to interpret.
Hold the new target for another two to three weeks before evaluating again. One change at a time. This is the core loop of self-coaching. Set, track, analyze, adjust.
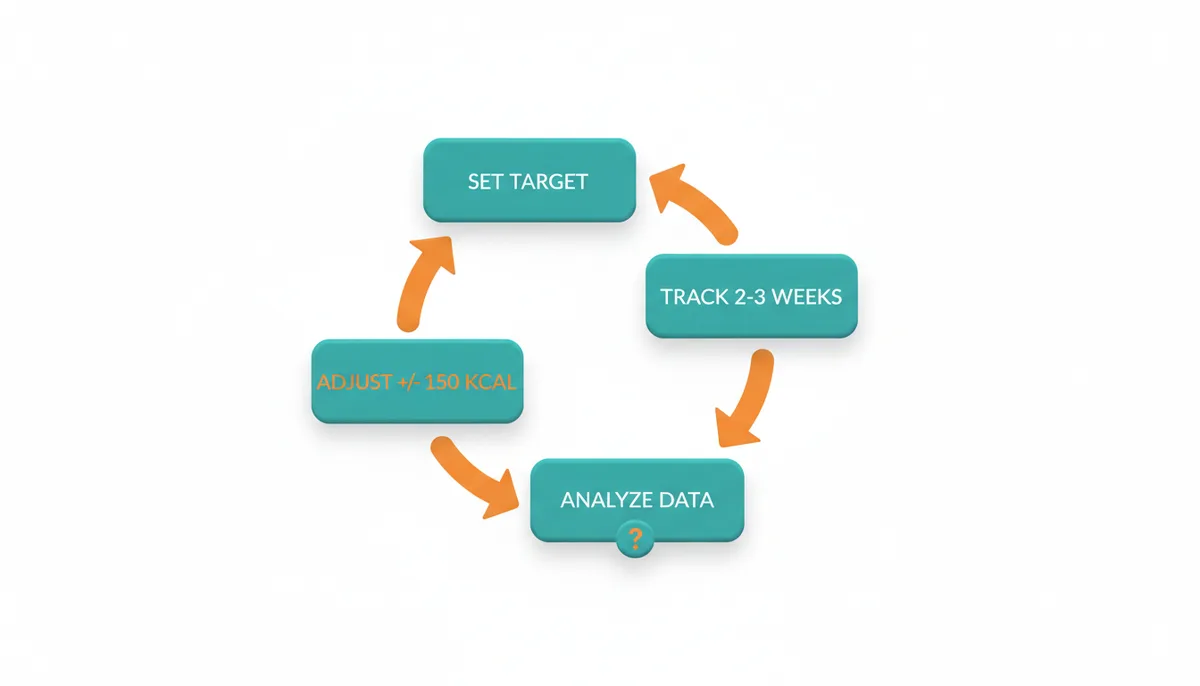
I prefer 150 calorie adjustments for most people. It is noticeable over a few weeks without being drastic. If you are very active or very large, you can use 200 to 250. The rule is make the smallest change that could plausibly move the trend.
Common Reasons Your Plan Isn't Working
Tracking errors are number one. Cooking oils, sauces, dressings, butter, nuts, and drinks add up fast. A tablespoon of oil is 120 calories and easy to miss. Weekend alcohol is another common leak. If you are not weighing food, you are estimating. Estimation drifts high over time.
Use a food scale for at least the first month. Log everything, even a sip of cream in coffee. Consistency beats perfection. If you log 90 percent of intake consistently, you will still see a real trend.
Metabolic adaptation is real. After weeks or months in a deficit, your body becomes more efficient. NEAT drops, hunger rises, and weight loss slows even at the same calories. That is not a failure. It is physiology. The fix is not to slash calories further. Options are a diet break at maintenance for one to two weeks, a modest refeed day, or a small further reduction. The best choice depends on how long you have been dieting and how you feel.
Psychology trips people up. One bad day leads to "I ruined it" and a three-day binge. Weekly average consistency matters more than daily perfection. If you go over one day, get back to target the next. The trend is built from the average, not a single meal.
Beyond Calories: Why Food Quality and Macronutrients Matter
Calories drive weight change. Macronutrients drive how you feel, performance, and body composition. 500 calories of chicken and broccoli affects hunger, muscle retention, and blood sugar differently than 500 calories of soda and chips. Guidance on macronutrients and practical nutrition priorities is widely recommended by nutrition professionals (Academy of Nutrition and Dietetics).
Protein is the priority for most people changing body composition. It supports muscle maintenance, increases satiety, and has a higher TEF than carbs or fat. A practical starting point is 0.7 to 1.0 gram per pound of body weight per day. Adjust based on tolerance and training.
Fats support hormone function and satiety. Carbohydrates fuel training and daily activity. You need all three. The exact split is personal, but getting protein right first makes the rest easier.
Once calories are dialed in, focus on food quality for sustainability. Fiber from vegetables, fruits, legumes, and whole grains improves fullness and gut health. Processed foods are easy to overeat because they are engineered for palatability. Whole foods slow you down.
| Diet Pattern | Meal Examples | Total Protein g | Total Fiber g | Likely Feeling |
|---|---|---|---|---|
| High Protein/Whole Foods | Greek yogurt with berries for breakfast, chicken salad bowl for lunch, salmon with brown rice and broccoli for dinner | 170 | 35 | Satiated and energized |
| Low Protein/Processed | Pancakes with syrup for breakfast, chips and dip for snack, frozen pizza for dinner | 60 | 12 | Hungry and sluggish |
| High Carb/Low Fat | Oatmeal with banana for breakfast, large pasta with tomato sauce for lunch, fruit smoothie for snack | 70 | 28 | Full then tired |
When to Ditch the Calculator and Seek Expert Help
Standard formulas work best for healthy adults with a relatively stable weight history. They are least accurate for elite athletes, people with high body fat, and individuals with diagnosed metabolic conditions like hypothyroidism or PCOS. If you fall in those groups, use the calculator as a rough start only.
If you have a history of disordered eating, do not use aggressive tracking and calorie targets. The method described here can be harmful. Work with a registered dietitian instead.
Seek professional help if you have unexplained weight changes, persistent fatigue, menstrual irregularities, or if you have been stuck for months despite consistent tracking. A registered dietitian or certified nutrition coach can assess medical factors, labs, and training load and build a plan that fits you.
For most people, the calculator plus a disciplined test-and-adjust loop is enough to find true maintenance calories within a few months. The skill you build is self-monitoring, not perfect prediction.
Why Your Maintenance Number Moves Down Even If You Do Nothing Different
You cut 300 calories and lose for three weeks, then the scale stalls. You are still eating the same, training the same, and you are suddenly eating at maintenance. That is not a broken calculator. That is adaptation.
When energy intake drops, the body reduces expenditure in places you cannot see. Leptin falls first. Leptin signals energy status to the hypothalamus. Lower leptin increases hunger and reduces spontaneous movement. You fidget less, you take the elevator instead of the stairs, you sit longer after dinner. That is NEAT downregulation, and the effect can be noticeable. Studies have reported reductions in spontaneous movement that some people experience as a meaningful drop in daily energy use, though the exact amount varies widely between individuals.
Thyroid output can also shift. T3 may modestly decline in a sustained deficit, which is associated with small changes in resting metabolic rate. The thermic effect of food falls too, because you are eating less total food. Muscle glycogen stores shrink, which reduces water weight and the energy cost of moving that water around. All of these changes are protective. They are the reason a 500 calorie deficit today is not the same deficit in month three.
The magnitude matters more than the fact. Research on prolonged deficits shows total energy expenditure can fall more than would be expected from weight loss alone, with the size of the effect varying widely between people. The drop tends to be larger in people who start with higher NEAT and in those who diet aggressively. A 20 percent cut from the start will tend to trigger a bigger adaptive response than a 10 percent cut, even if both lead to the same initial weight loss.
You can work with this instead of fighting it. Smaller deficits preserve NEAT better. Adequate protein and resistance training protect lean mass, which protects resting burn. Sleep and stress management matter because both influence NEAT and hunger hormones. If you have been in a deficit for 8 to 12 weeks and progress stopped despite consistent tracking, a planned diet break at estimated maintenance for 10 to 14 days can help improve adherence, reduce diet fatigue, and support training performance, which makes the next phase more sustainable. The goal is not to outsmart adaptation. It is to keep the adaptation small enough that you can still progress.
An Eight-Week Example With Real Numbers
Take a concrete case. Jamie is 34, 5'9", 195 lb, trains three times a week with lifting and walks about 7,000 steps a day. The Mifflin-St Jeor estimate puts BMR around 1,890. With an activity factor of 1.55, the calculator gives 2,930 calories. That is the hypothesis.
Weeks 1 to 2, Jamie eats 2,930 calories daily, weighed with a food scale, protein around 170 grams. Daily weights: 195.2, 194.8, 195.6, 195.0, 194.6, 195.4, 195.0. Weekly average 195.1. No trend yet, too early.
Weeks 3 to 4, intake holds at 2,930. Weights: 194.9, 194.5, 195.1, 194.7, 194.3, 194.9, 194.6. Weekly average 194.7. That is a 0.4 lb drop over two weeks, essentially flat. Maintenance for Jamie is close to 2,930, maybe slightly higher.
Goal is fat loss, about 0.6 to 0.8 lb per week. Jamie needs a deficit. Instead of slashing, he drops 200 calories to 2,730 and keeps training the same. Weeks 5 to 6: weights 194.4, 194.0, 194.6, 194.2, 193.8, 194.4, 194.1. Average 194.2. Down 0.5 lb from previous average. Weeks 7 to 8: weights 193.9, 193.5, 194.1, 193.7, 193.3, 193.9, 193.6. Average 193.7. Down 0.5 lb again.
Two months of data shows a clear, sustainable trend at 2,730. That is Jamie's true maintenance minus about 200 calories. If he wanted faster loss, he could drop another 150 calories, but he would accept more hunger and a higher risk of NEAT loss. He chooses to stay here and reassess after another four weeks.
| Period | Target Calories | Weekly Avg Weight lb | Change lb |
|---|---|---|---|
| Weeks 1-2 | 2930 | 195.1 | baseline |
| Weeks 3-4 | 2930 | 194.7 | -0.4 |
| Weeks 5-6 | 2730 | 194.2 | -0.5 |
| Weeks 7-8 | 2730 | 193.7 | -0.5 |
The calculator was not wrong. It was a starting point 200 calories high for Jamie. Without the baseline test, he would have guessed and likely oscillated between too low and too high.
The Real Cost Of Tracking And How To Make It Sustainable
Daily tracking costs time and attention. For most people it is 5 to 10 minutes a day once the habit is set, more at first. Logging every meal with a food scale is the most accurate method and the most tedious. Apps are free, a decent scale is 15 to 30 dollars, and a kitchen scale lasts years. The real cost is mental load.
Tracking works best when it is boring and routine. Batch logging helps. Pre-log tomorrow's meals the night before. Save frequent meals as recipes in the app so you are not rebuilding them each time. Weigh proteins and fats once and reuse the numbers. Accept 90 percent accuracy for condiments and restaurant meals rather than chasing perfect entries and burning out.
There is a fatigue curve. The first two weeks feel novel. Weeks three to six feel tedious. Around week eight many people either automate or quit. Automation looks like a consistent template of breakfast, lunch, dinner, and snacks that meets your calorie and protein targets without daily recalculation. You still weigh the template foods once, then trust it.
If you cannot sustain daily logging, you can shift to a hybrid. Track fully for two weeks every three months to recalibrate, and use hand portions the rest of the time. A palm of protein, a fist of vegetables, a cupped hand of carbs, a thumb of fat gives you a reasonable estimate once you know what your maintenance looks like. It is less precise, but precision only matters if you will use it.
I would tell most people to track fully for the first 4 to 8 weeks to find their true numbers, then move to a lighter system. The skill you keep is self-monitoring, not the app. You want to know what a maintenance day feels like, how hunger changes with protein, and how your weight responds to a 150 calorie shift. After that, you can track loosely and still steer with weekly averages and the occasional check-in.
FAQ
How often should I recalculate my calories using the online calculator?
Recalculate only after a meaningful change. A common rule is after about a 10 percent change in body weight or a major, sustained change in activity level. Otherwise, keep adjusting based on your real-world tracking data. Recalculating too often just gives you a new starting point without learning anything about your actual response.
Why did my weight go up overnight even though I was in a deficit?
Daily weight fluctuates with water, glycogen, sodium, and hormonal shifts. A high-carb or high-salt day can add several pounds of water. Menstrual cycles add variability. Trust the weekly average, not the daily number. If the weekly average trends down over three to four weeks, you are still in a deficit.
Can I trust the calorie numbers in my food tracking app?
App databases contain user-generated entries and can be off by 10 to 20 percent. Use verified entries from USDA sources when possible and check product labels for packaged foods. Consistent tracking with the same sources is more valuable than perfect accuracy. If you are always using the same slightly off entries, the trend will still be real.
What if I don't want to count calories? Are there alternatives?
Yes. Once you have a sense of your needs, methods like hand portions can work. A palm of protein, a fist of vegetables, a cupped hand of carbs, and a thumb of fat is a simple heuristic. Mindful eating and regular meals also help. These methods are less precise and slower to adjust, but they can be more sustainable for some people.
Is it better to eat more and exercise more, or eat less and exercise less?
For fat loss while keeping muscle, a moderate calorie deficit combined with resistance training is usually best. Eating more to fuel more activity can be healthier and more sustainable than severe restriction. The trade-off is time and recovery. If you cannot train consistently, a modest deficit with daily movement is still effective.
Will a cheat day ruin my progress?
A single high-calorie day will not ruin progress. It can erase a portion of your weekly deficit, which may slow the trend. Planning enjoyable foods within your weekly budget is more effective than an uncontrolled cheat day. Structured refeed days at maintenance can help with diet adherence without derailing progress.
Sources
- Academy of Nutrition and Dietetics — General principles of energy balance, macronutrients, and the role of a registered dietitian.
- National Institutes of Health (NIH) PubMed Central — The original research paper for the Mifflin-St Jeor equation, validating it as a predictive BMR formula.
- American Council on Exercise (ACE) — Definitions of physical activity levels and their impact on total daily energy expenditure (TDEE).
- Centers for Disease Control and Prevention (CDC) — Fundamental concepts of calories, energy balance, and healthy weight management for the general public.
- Examine.com — In-depth, evidence-based analysis of nutritional concepts like metabolic adaptation, NEAT, and macronutrient roles.